Annual report design is changing – and fast. What was once a largely static, compliance‑driven document is increasingly expected to be a strategic communication tool: one that tells a clear story, meets growing regulatory requirements, and works seamlessly across print and digital formats.
As we move into 2026, organisations are rethinking not just how their annual reports look, but how they’re produced, accessed and experienced. Based on what we’re seeing across sustainability reports, annual reports and corporate plans, here are the key annual report design trends shaping the year ahead.
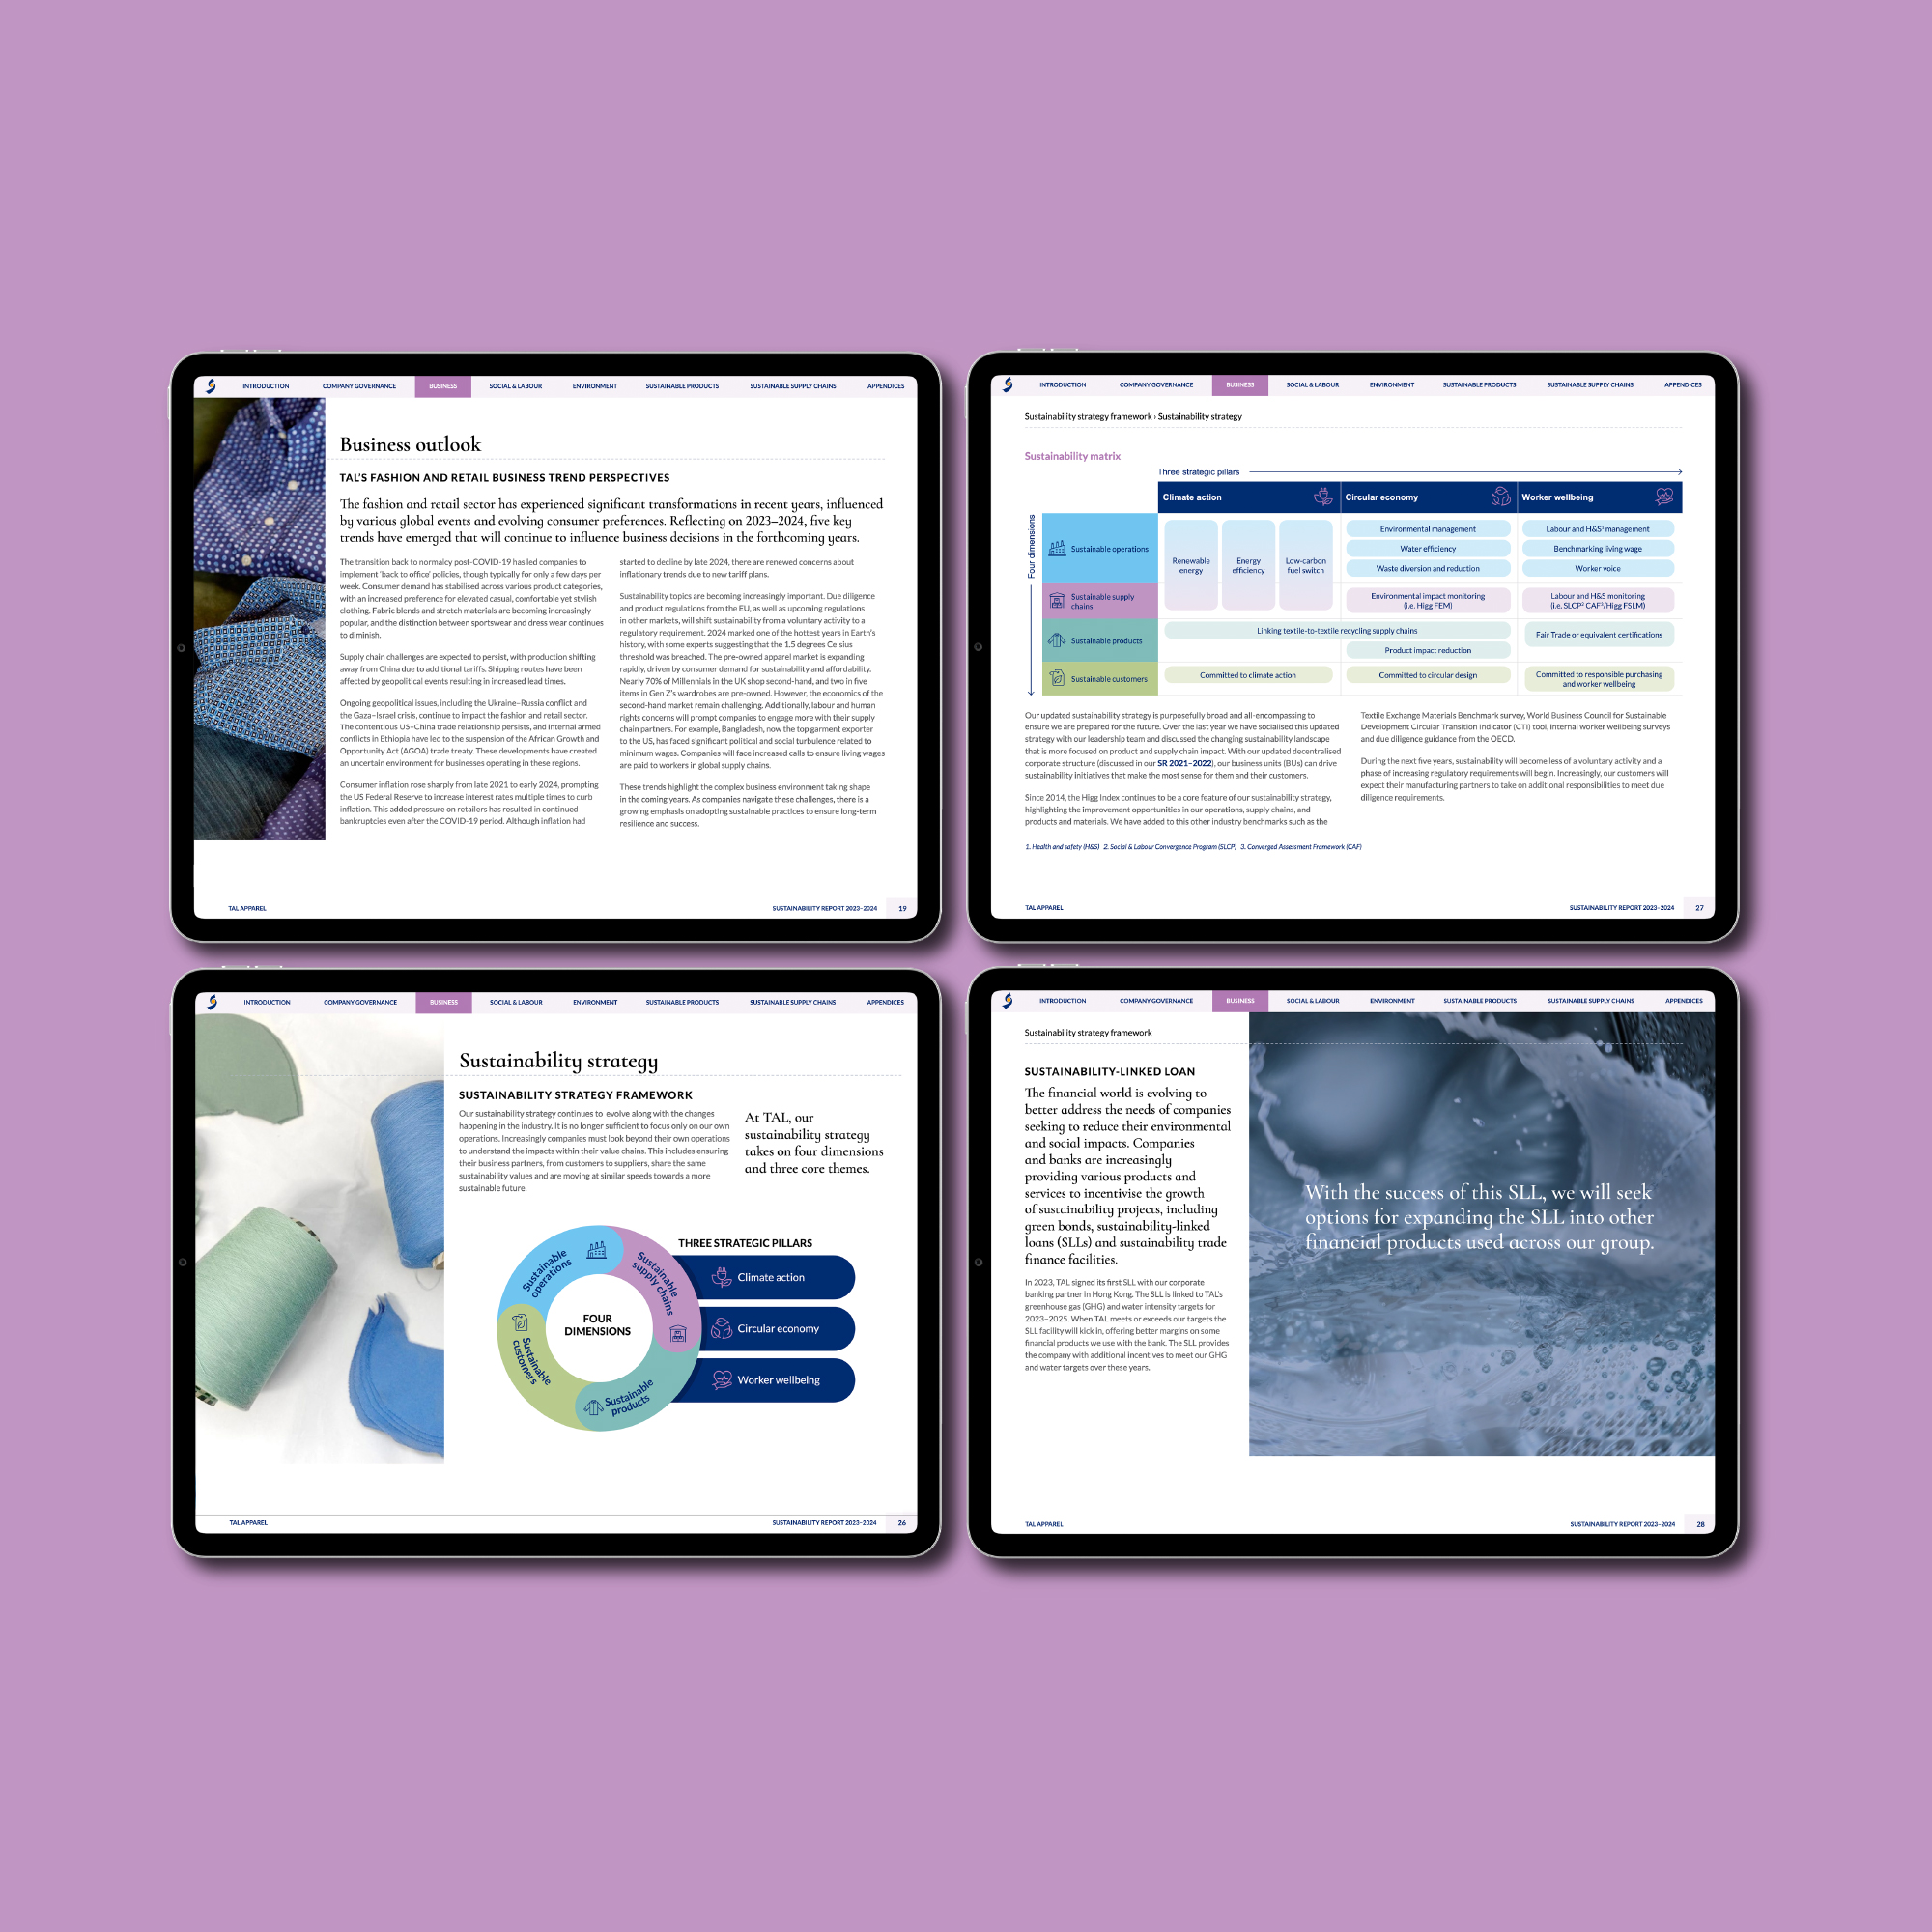
1. Digital‑first thinking (even when the output is still a PDF)
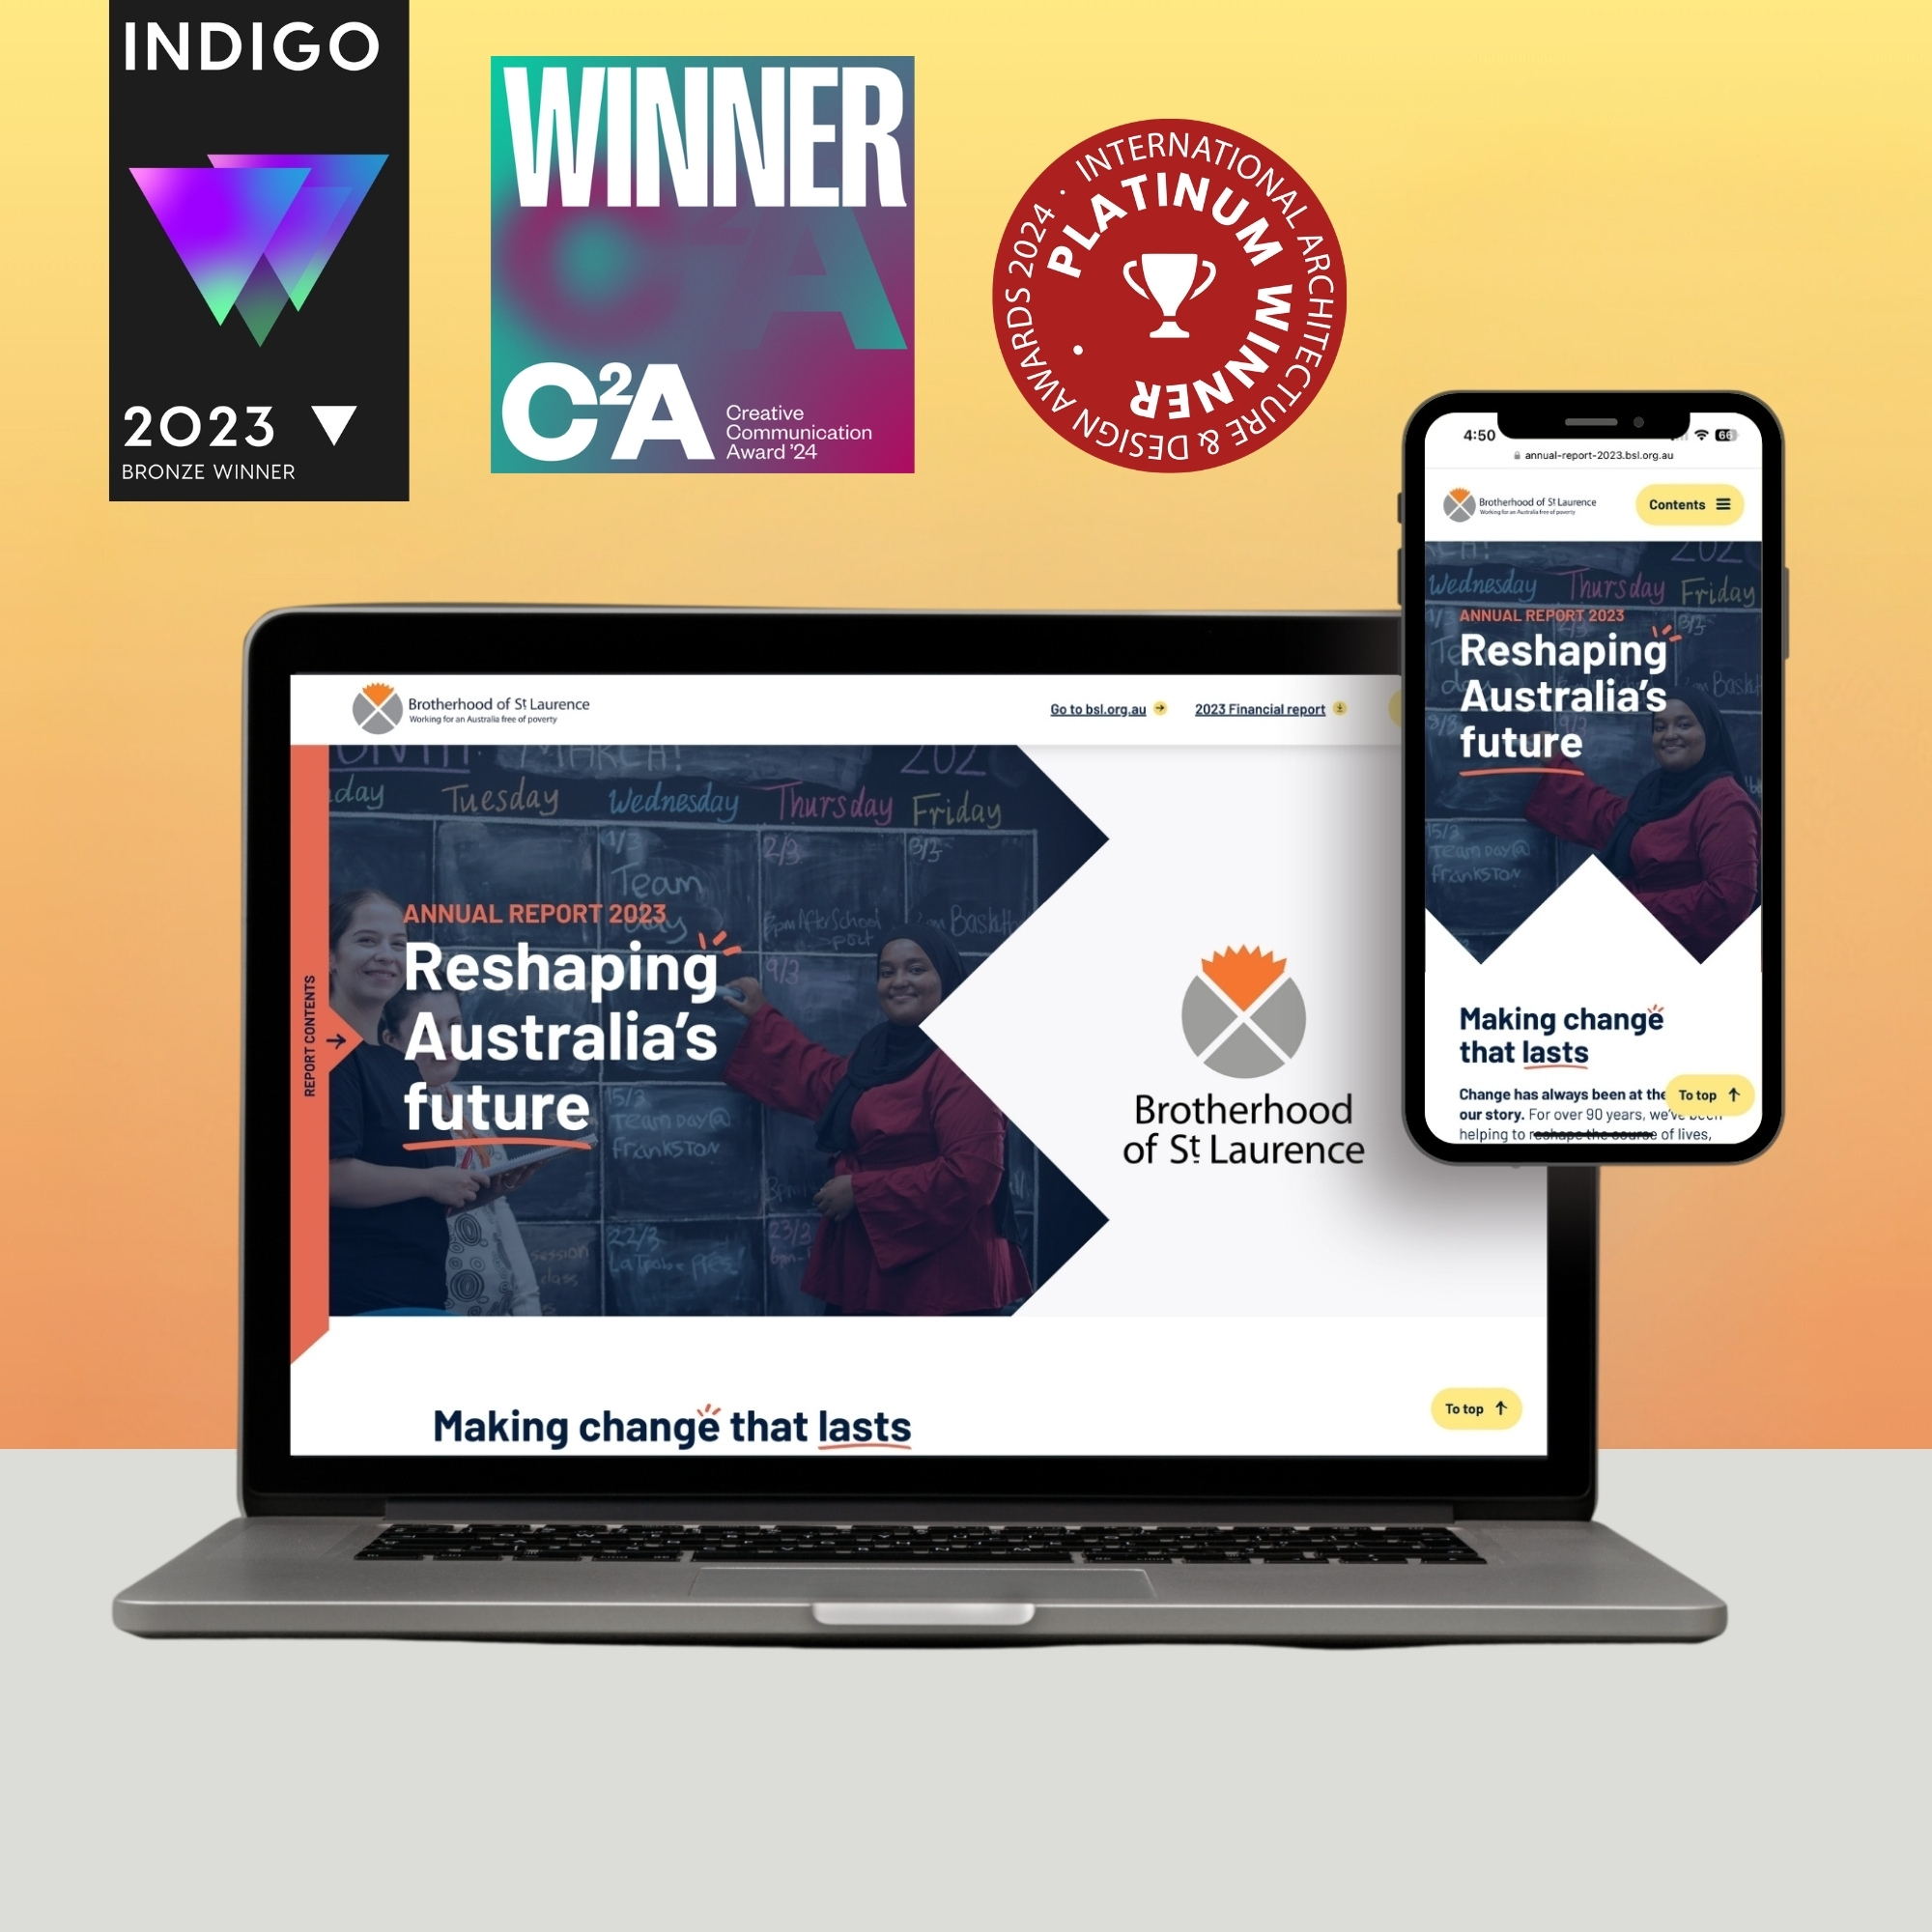
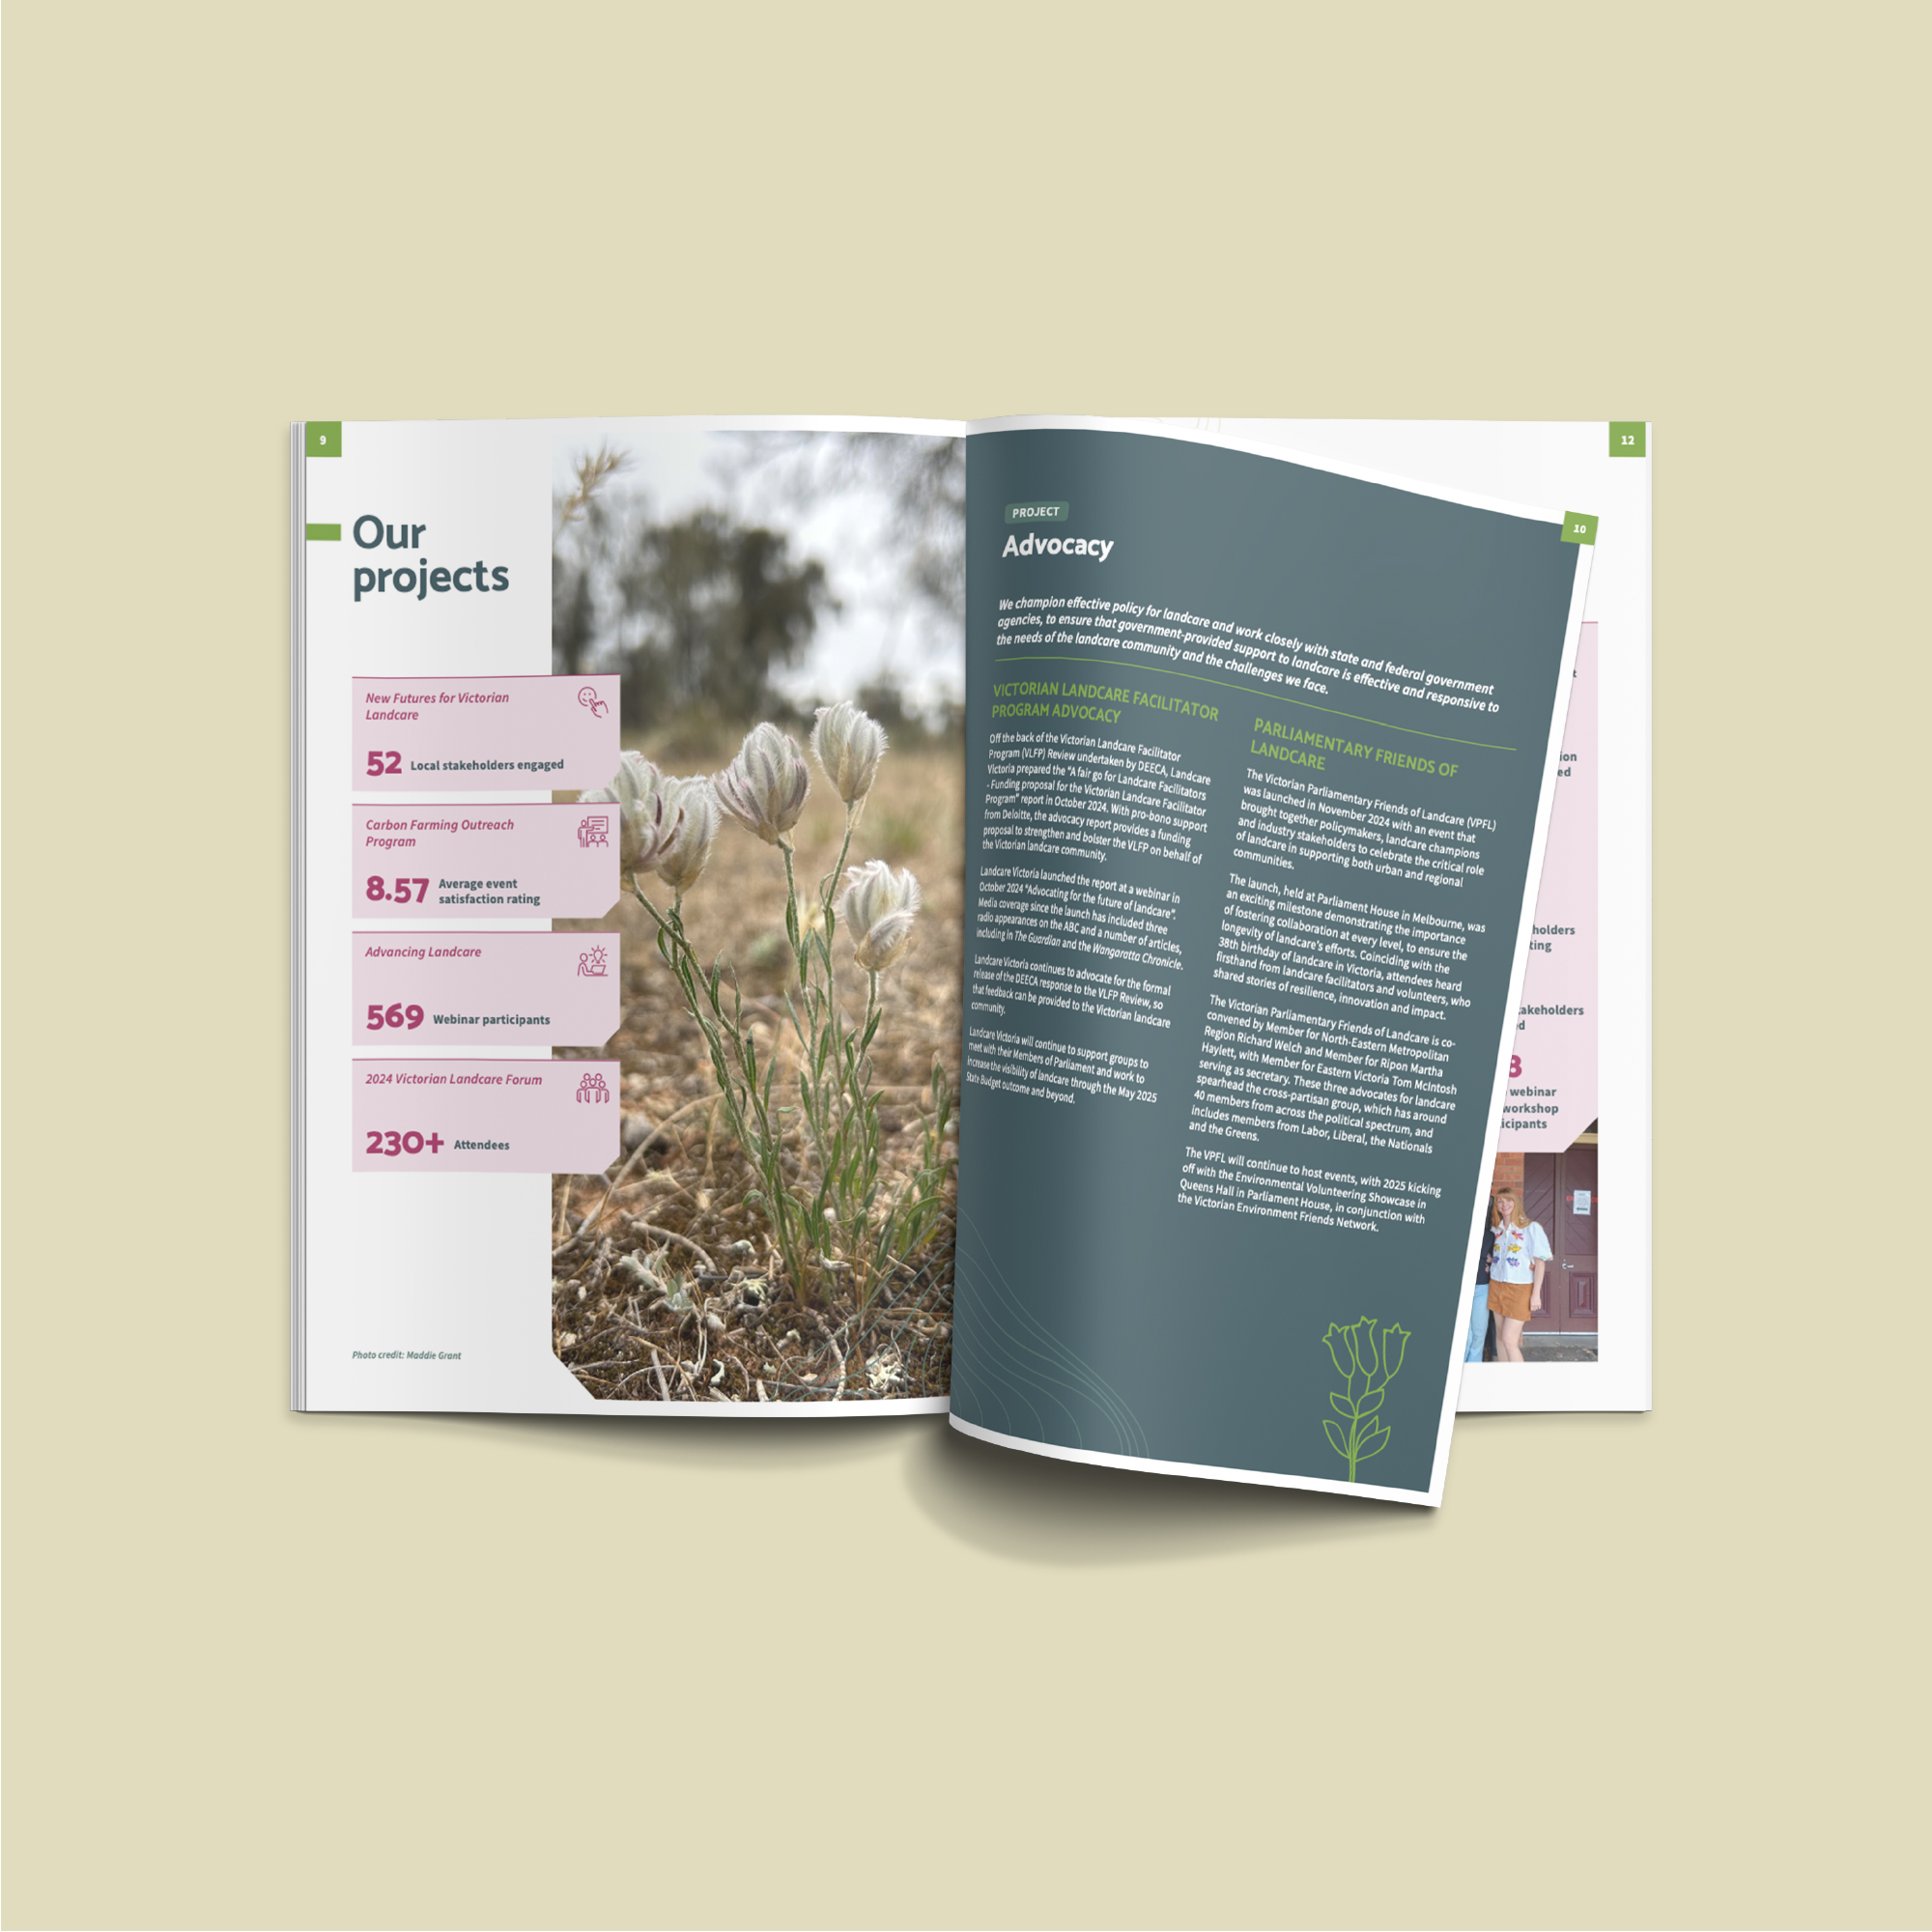
While fully web‑based annual reports are on the rise, the PDF is far from dead. In fact, PDF‑style annual report design remains popular because it’s easy to share, archive, email and print. What is changing is how PDFs are designed.
More organisations are treating their annual report PDFs like mini‑websites rather than static documents. This includes:
- Clickable contents pages and navigation menus
- Internal hyperlinks between sections
- Clear visual hierarchy that mirrors a web experience
- Interactive elements such as expandable sections or linked data tables
This approach gives readers flexibility, allowing them to skim, jump between sections, or deep dive where needed, while still retaining the familiarity of a traditional annual report format. See an example of this in practice here.
2. Web‑based and interactive reports powered by AI tools
Alongside enhanced PDFs, we’re seeing growing interest in fully digital, web‑based annual reports. Advances in AI‑assisted design and development tools are making this more achievable, even for teams without large budgets.
In 2026, organisations are increasingly asking their designers to:
- Use AI tools to speed up layout, formatting and content adaptation (e.g. Adobe Firefly, Canva Magic Design, Figma AI, and ChatGPT for content structuring).
- Repurpose annual report content across PDF, web and social formats
- Create modular designs that can be easily updated year‑to‑year
The result is a more flexible reporting ecosystem, where one core set of content can live across multiple platforms, rather than being locked into a single annual report file.
3. Accessibility is no longer optional
Accessibility in annual report design has moved from a ‘nice‑to‑have’ to a shared responsibility. Clients are becoming more informed, and more accountable, for ensuring their reports can be read and understood by as many people as possible.
Key accessibility considerations we’re seeing built into report design briefs include:
- Strong colour contrast between text and background
- Clear, legible typography (including minimum font sizes)
- Logical reading order for screen readers
- Descriptive link text and headings
Many organisations are now proactively using accessibility checking tools as part of their review process, such as:
- Colour contrast checkers (e.g. WebAIM Contrast Checker, TPGi Colour Contrast Checker, Adobe Color Accessibility Tools)
- PDF accessibility checkers (e.g. Adobe Acrobat Accessibility Checker, PDF Accessibility Checker (PAC))
- Screen reader previews (e.g. NVDA Screen Reader, Apple’s built-in VoiceOver).
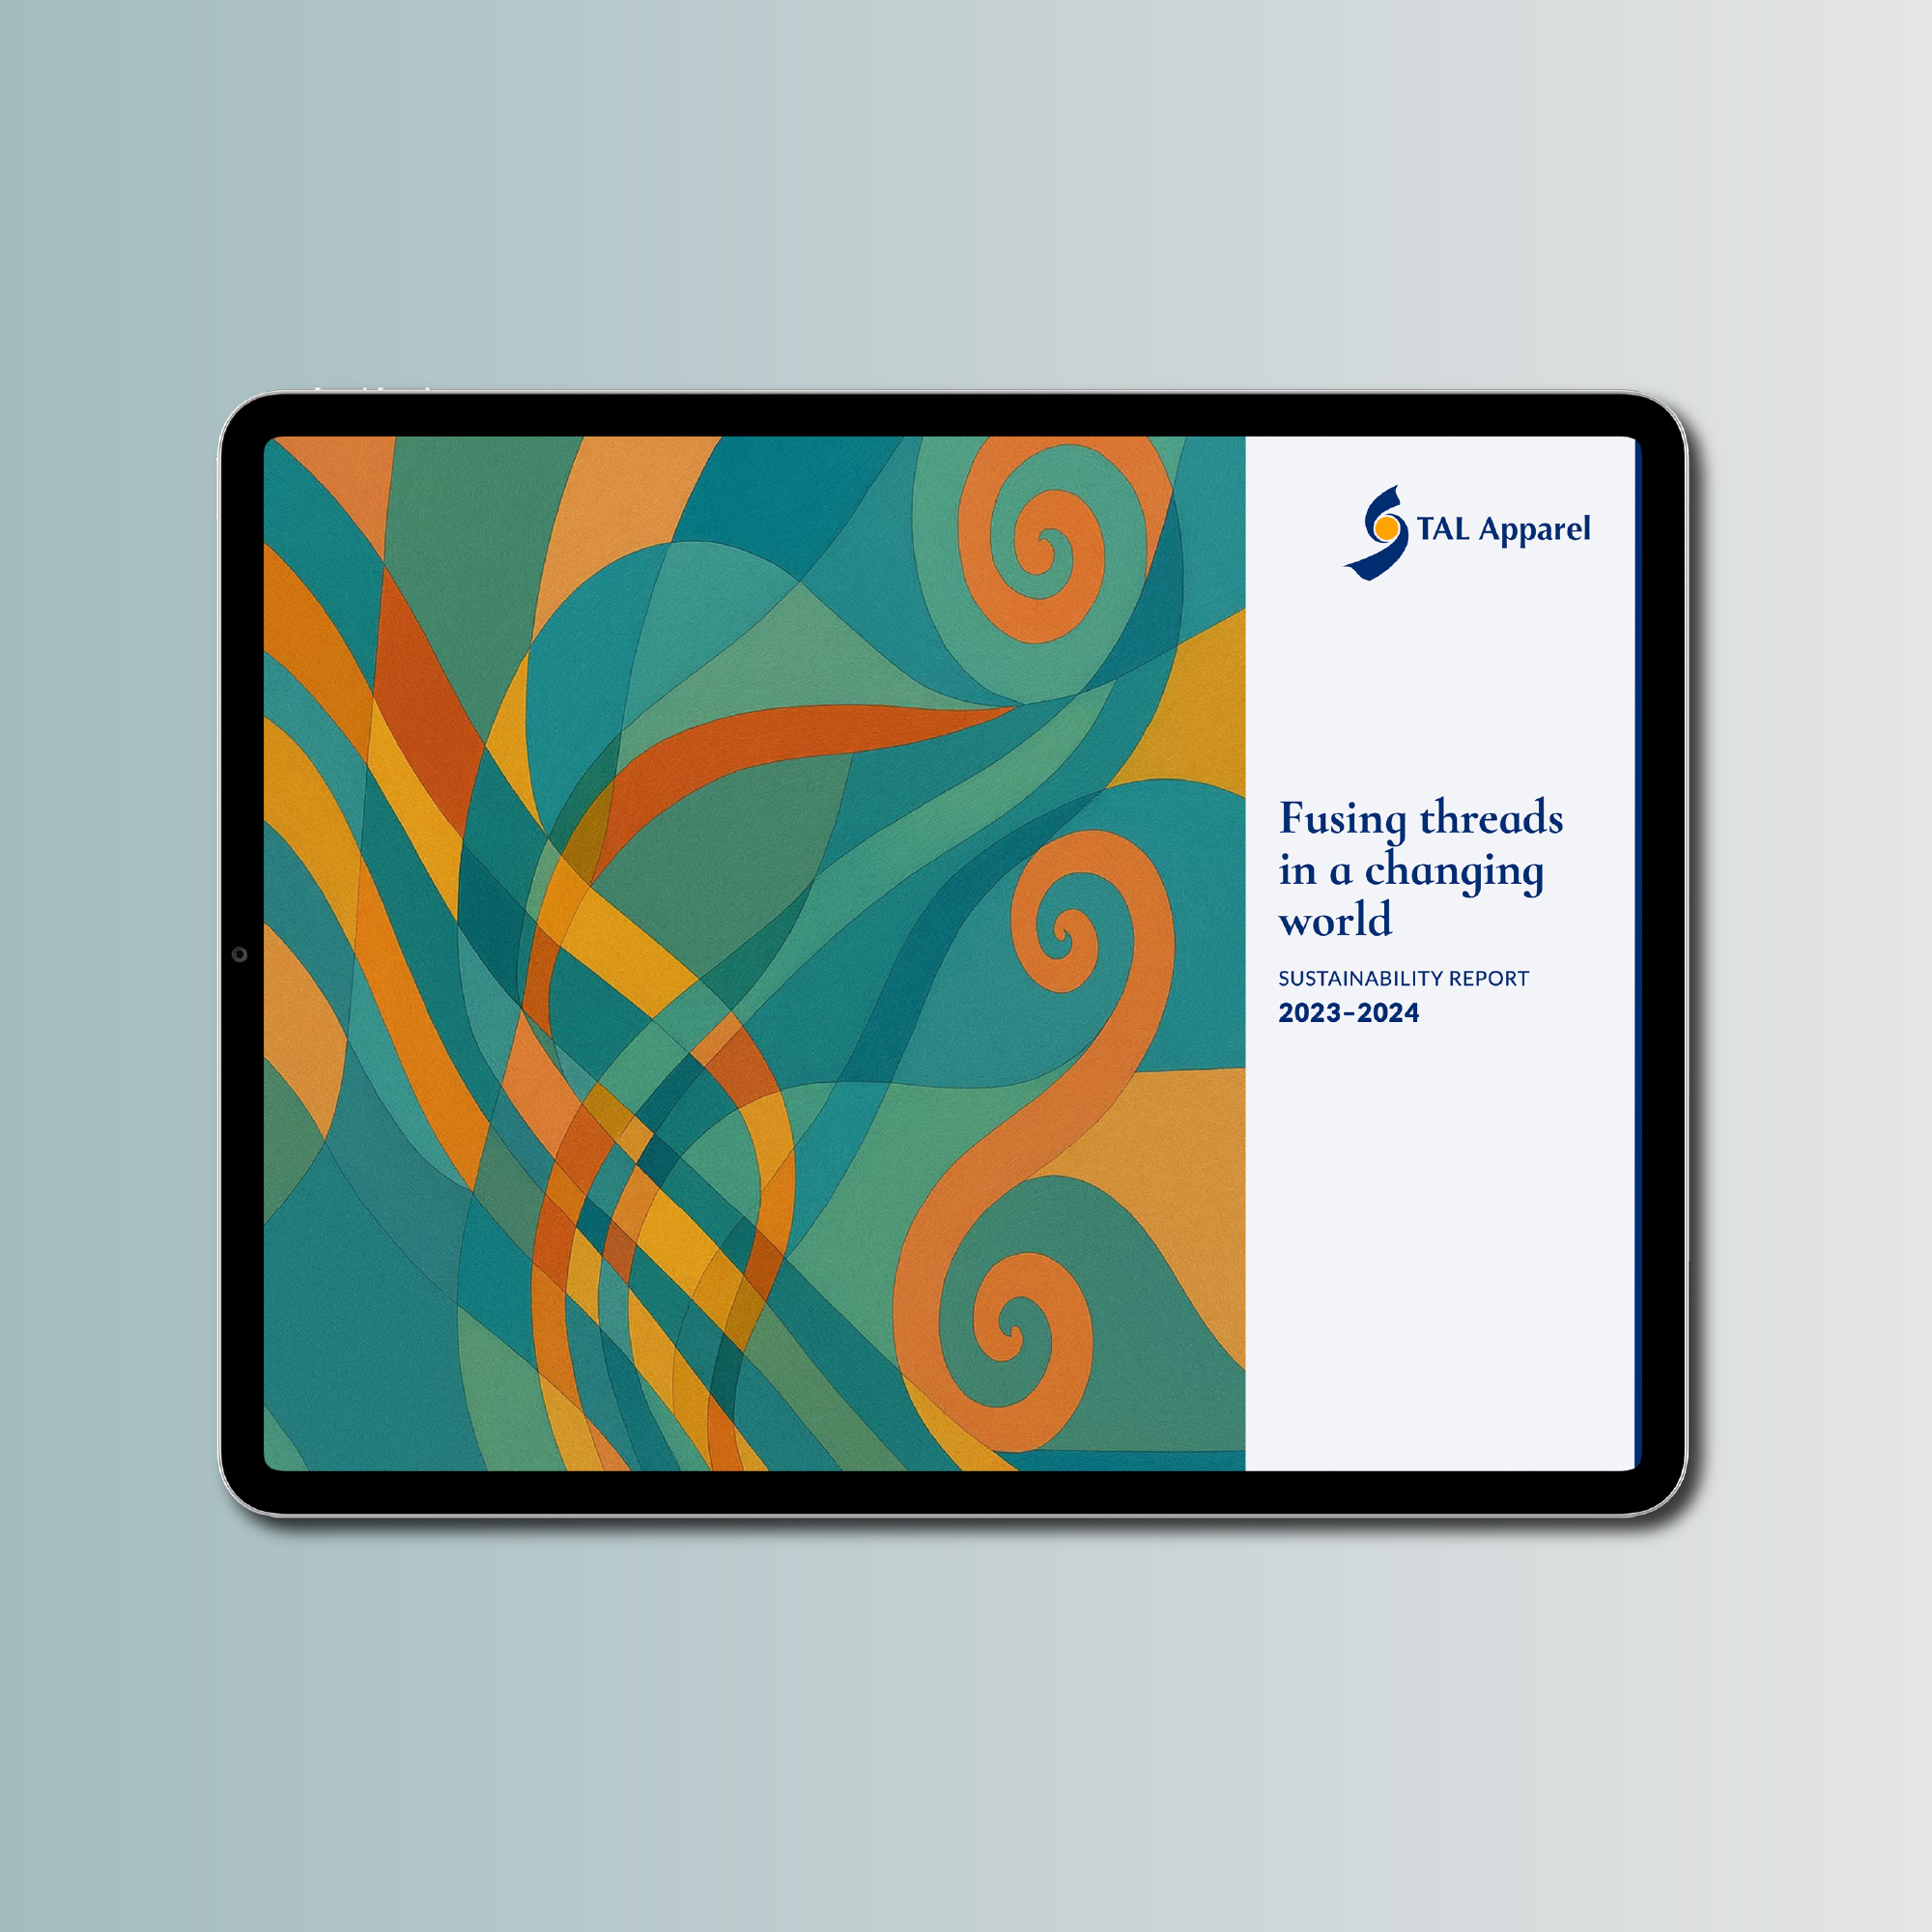
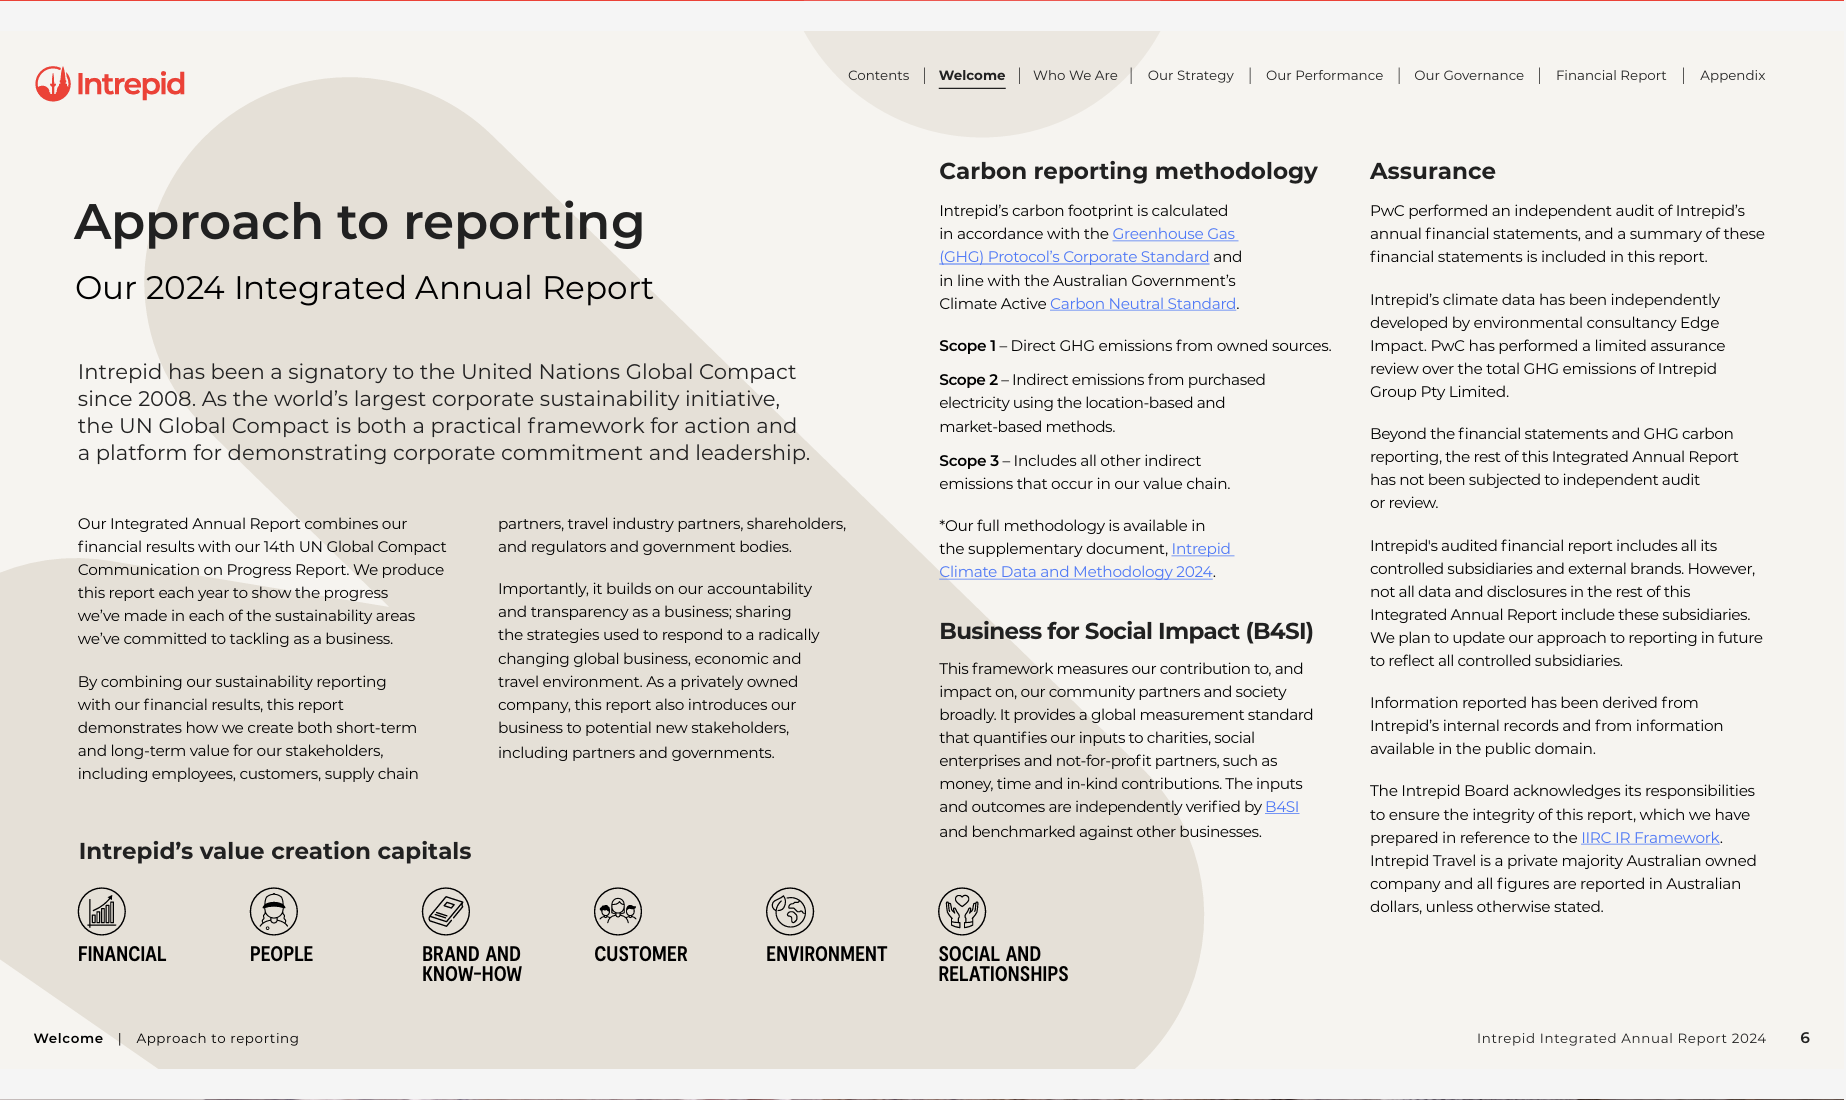
4. Sustainability reporting is reshaping annual reports
Globally, sustainability reporting requirements are expanding. New and evolving regulations across multiple governments mean larger organisations are now required to disclose more detailed sustainability, climate and ESG data.
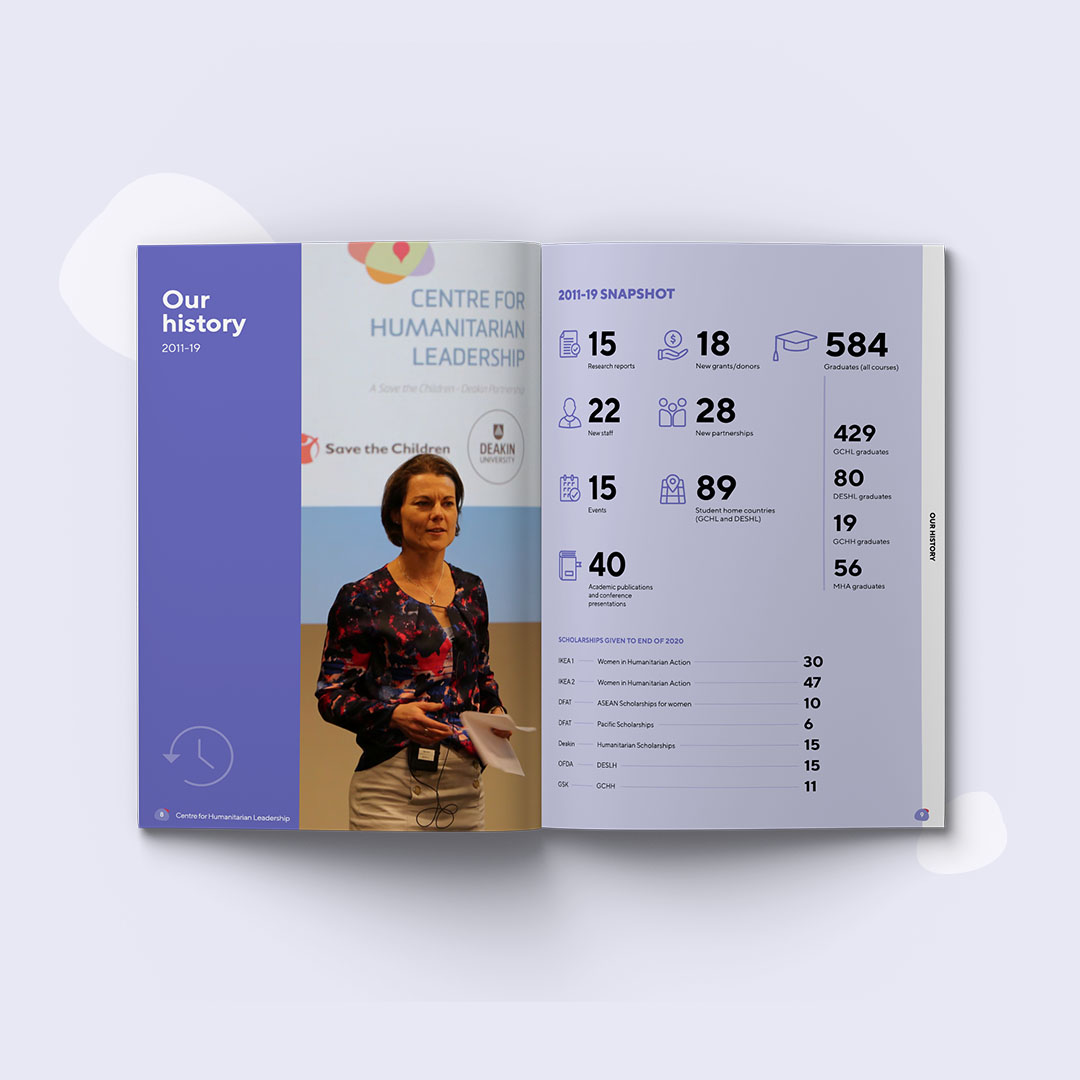
This shift is influencing annual report design in several ways:
- Sustainability content is becoming more prominent within annual reports
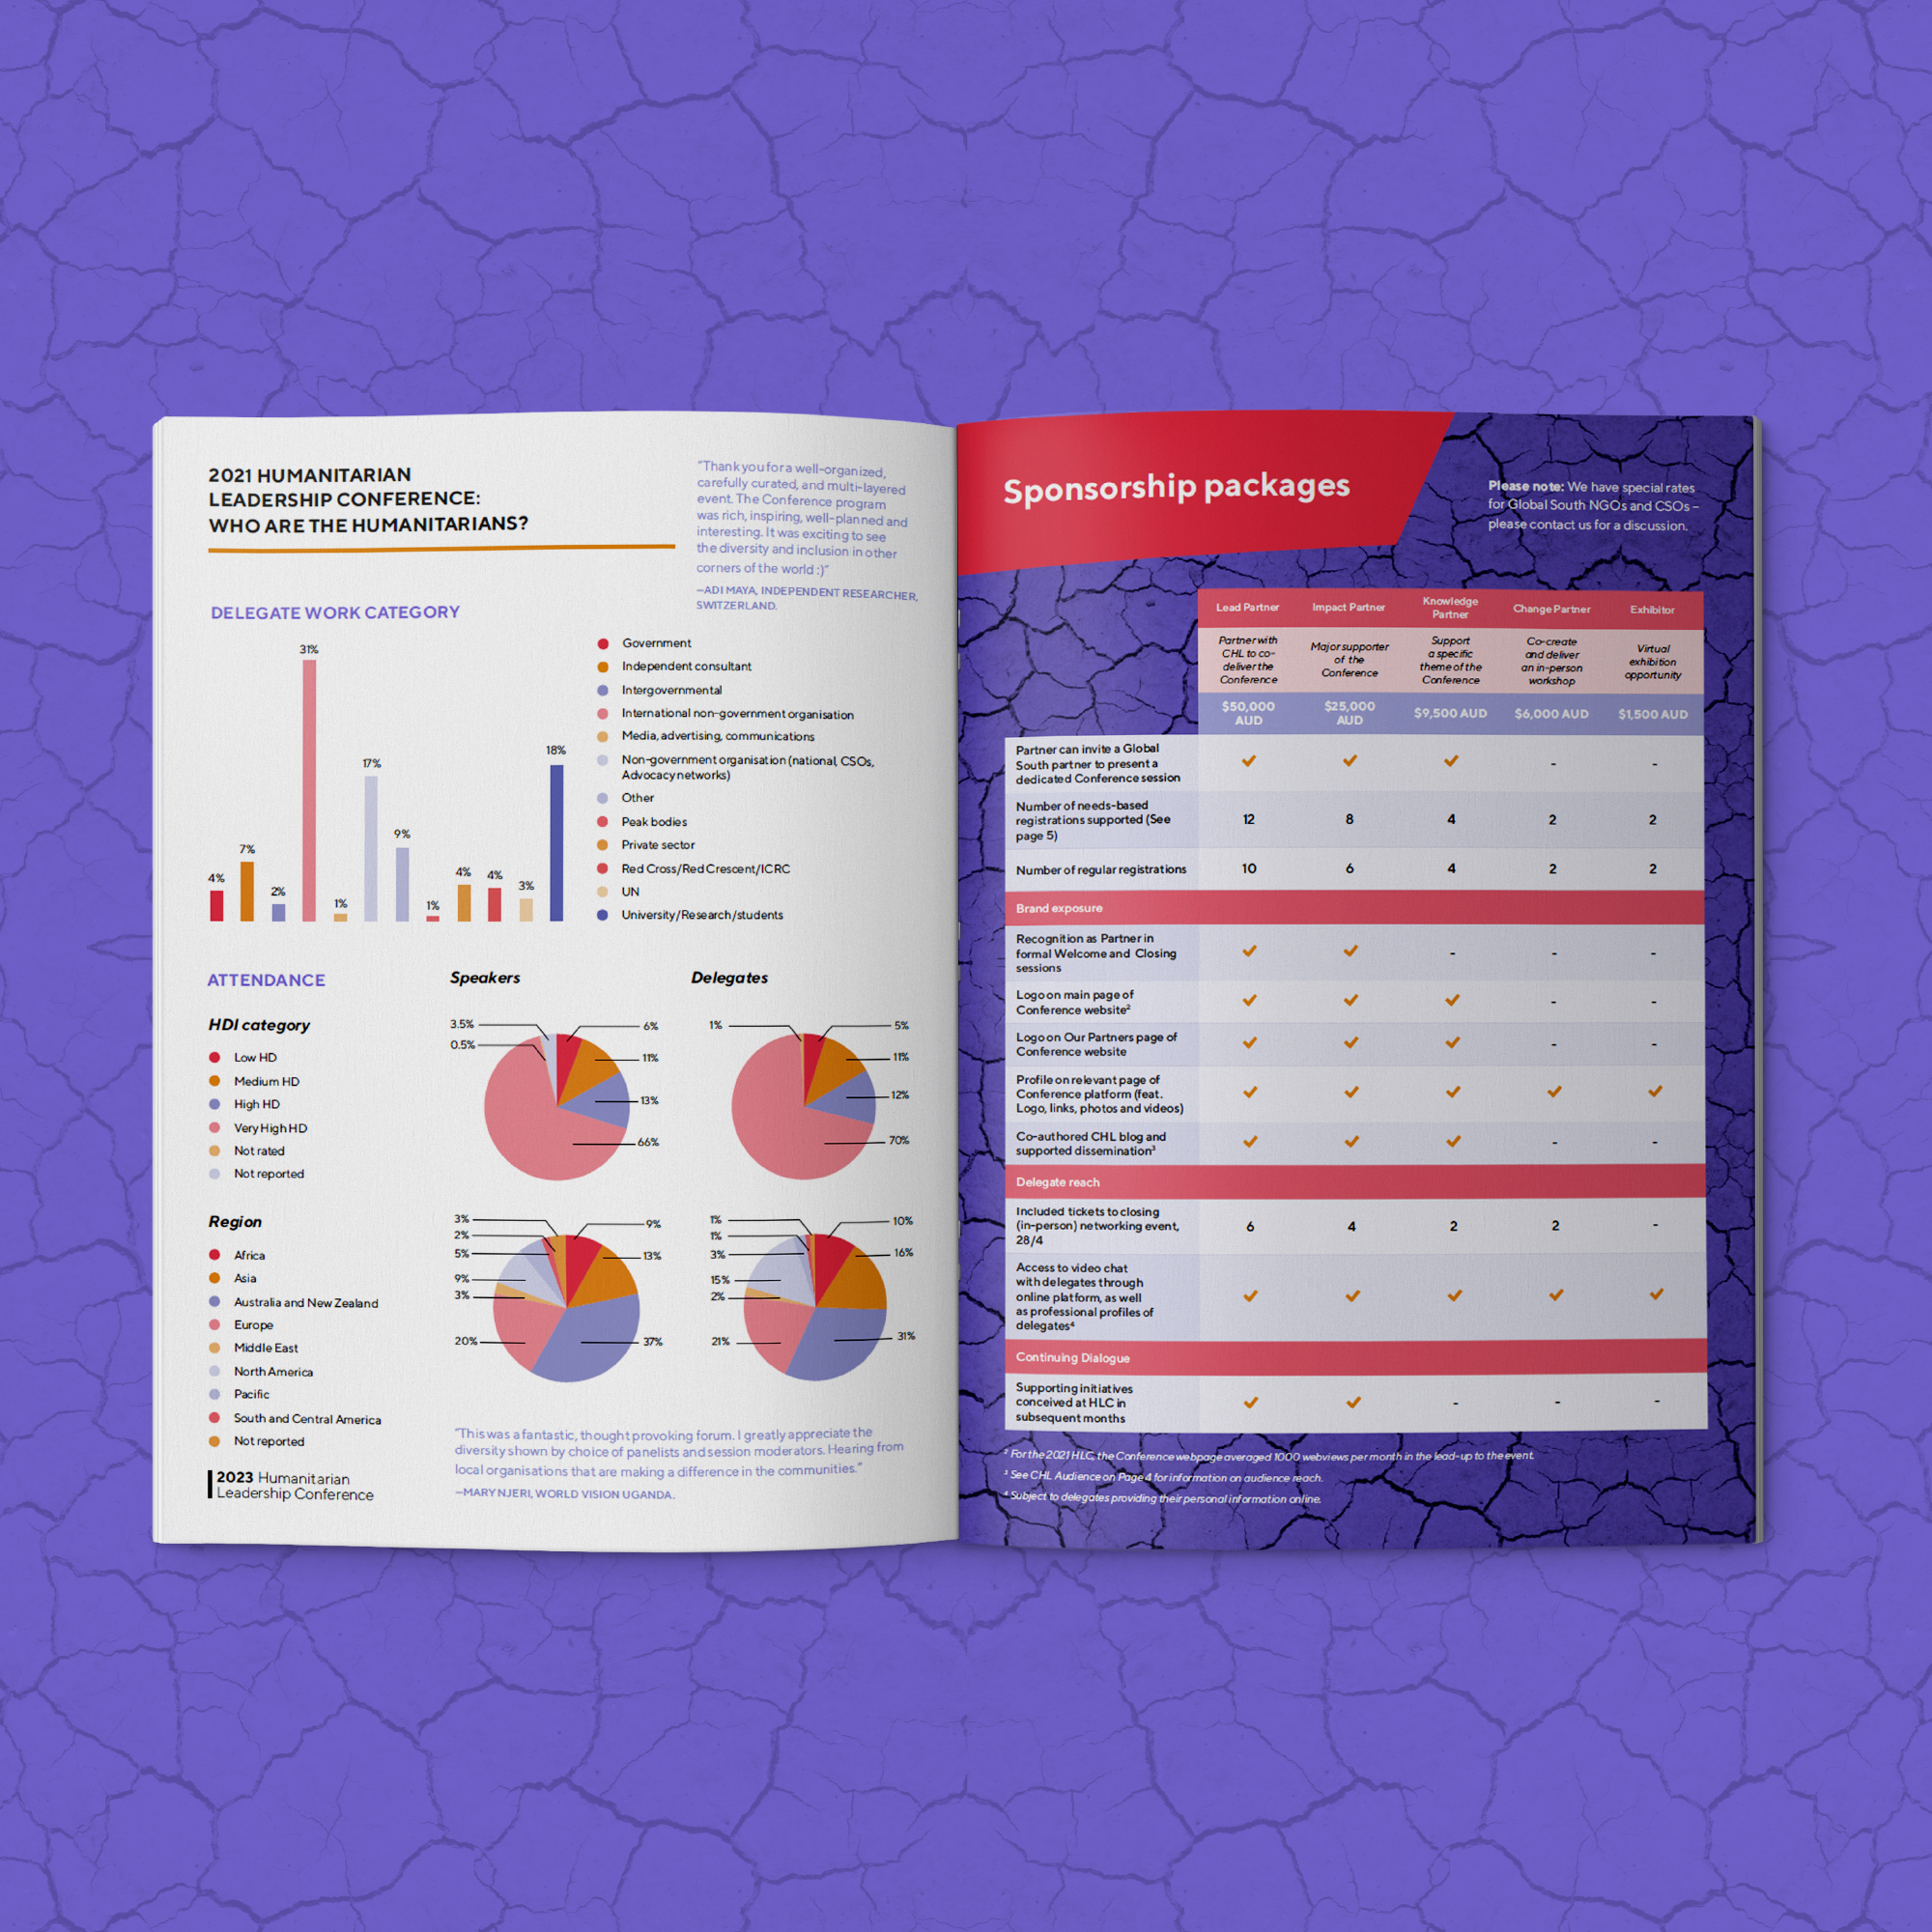
- ESG reports are increasingly integrated with financial and annual reporting
- Data visualisation is playing a bigger role in explaining complex metrics
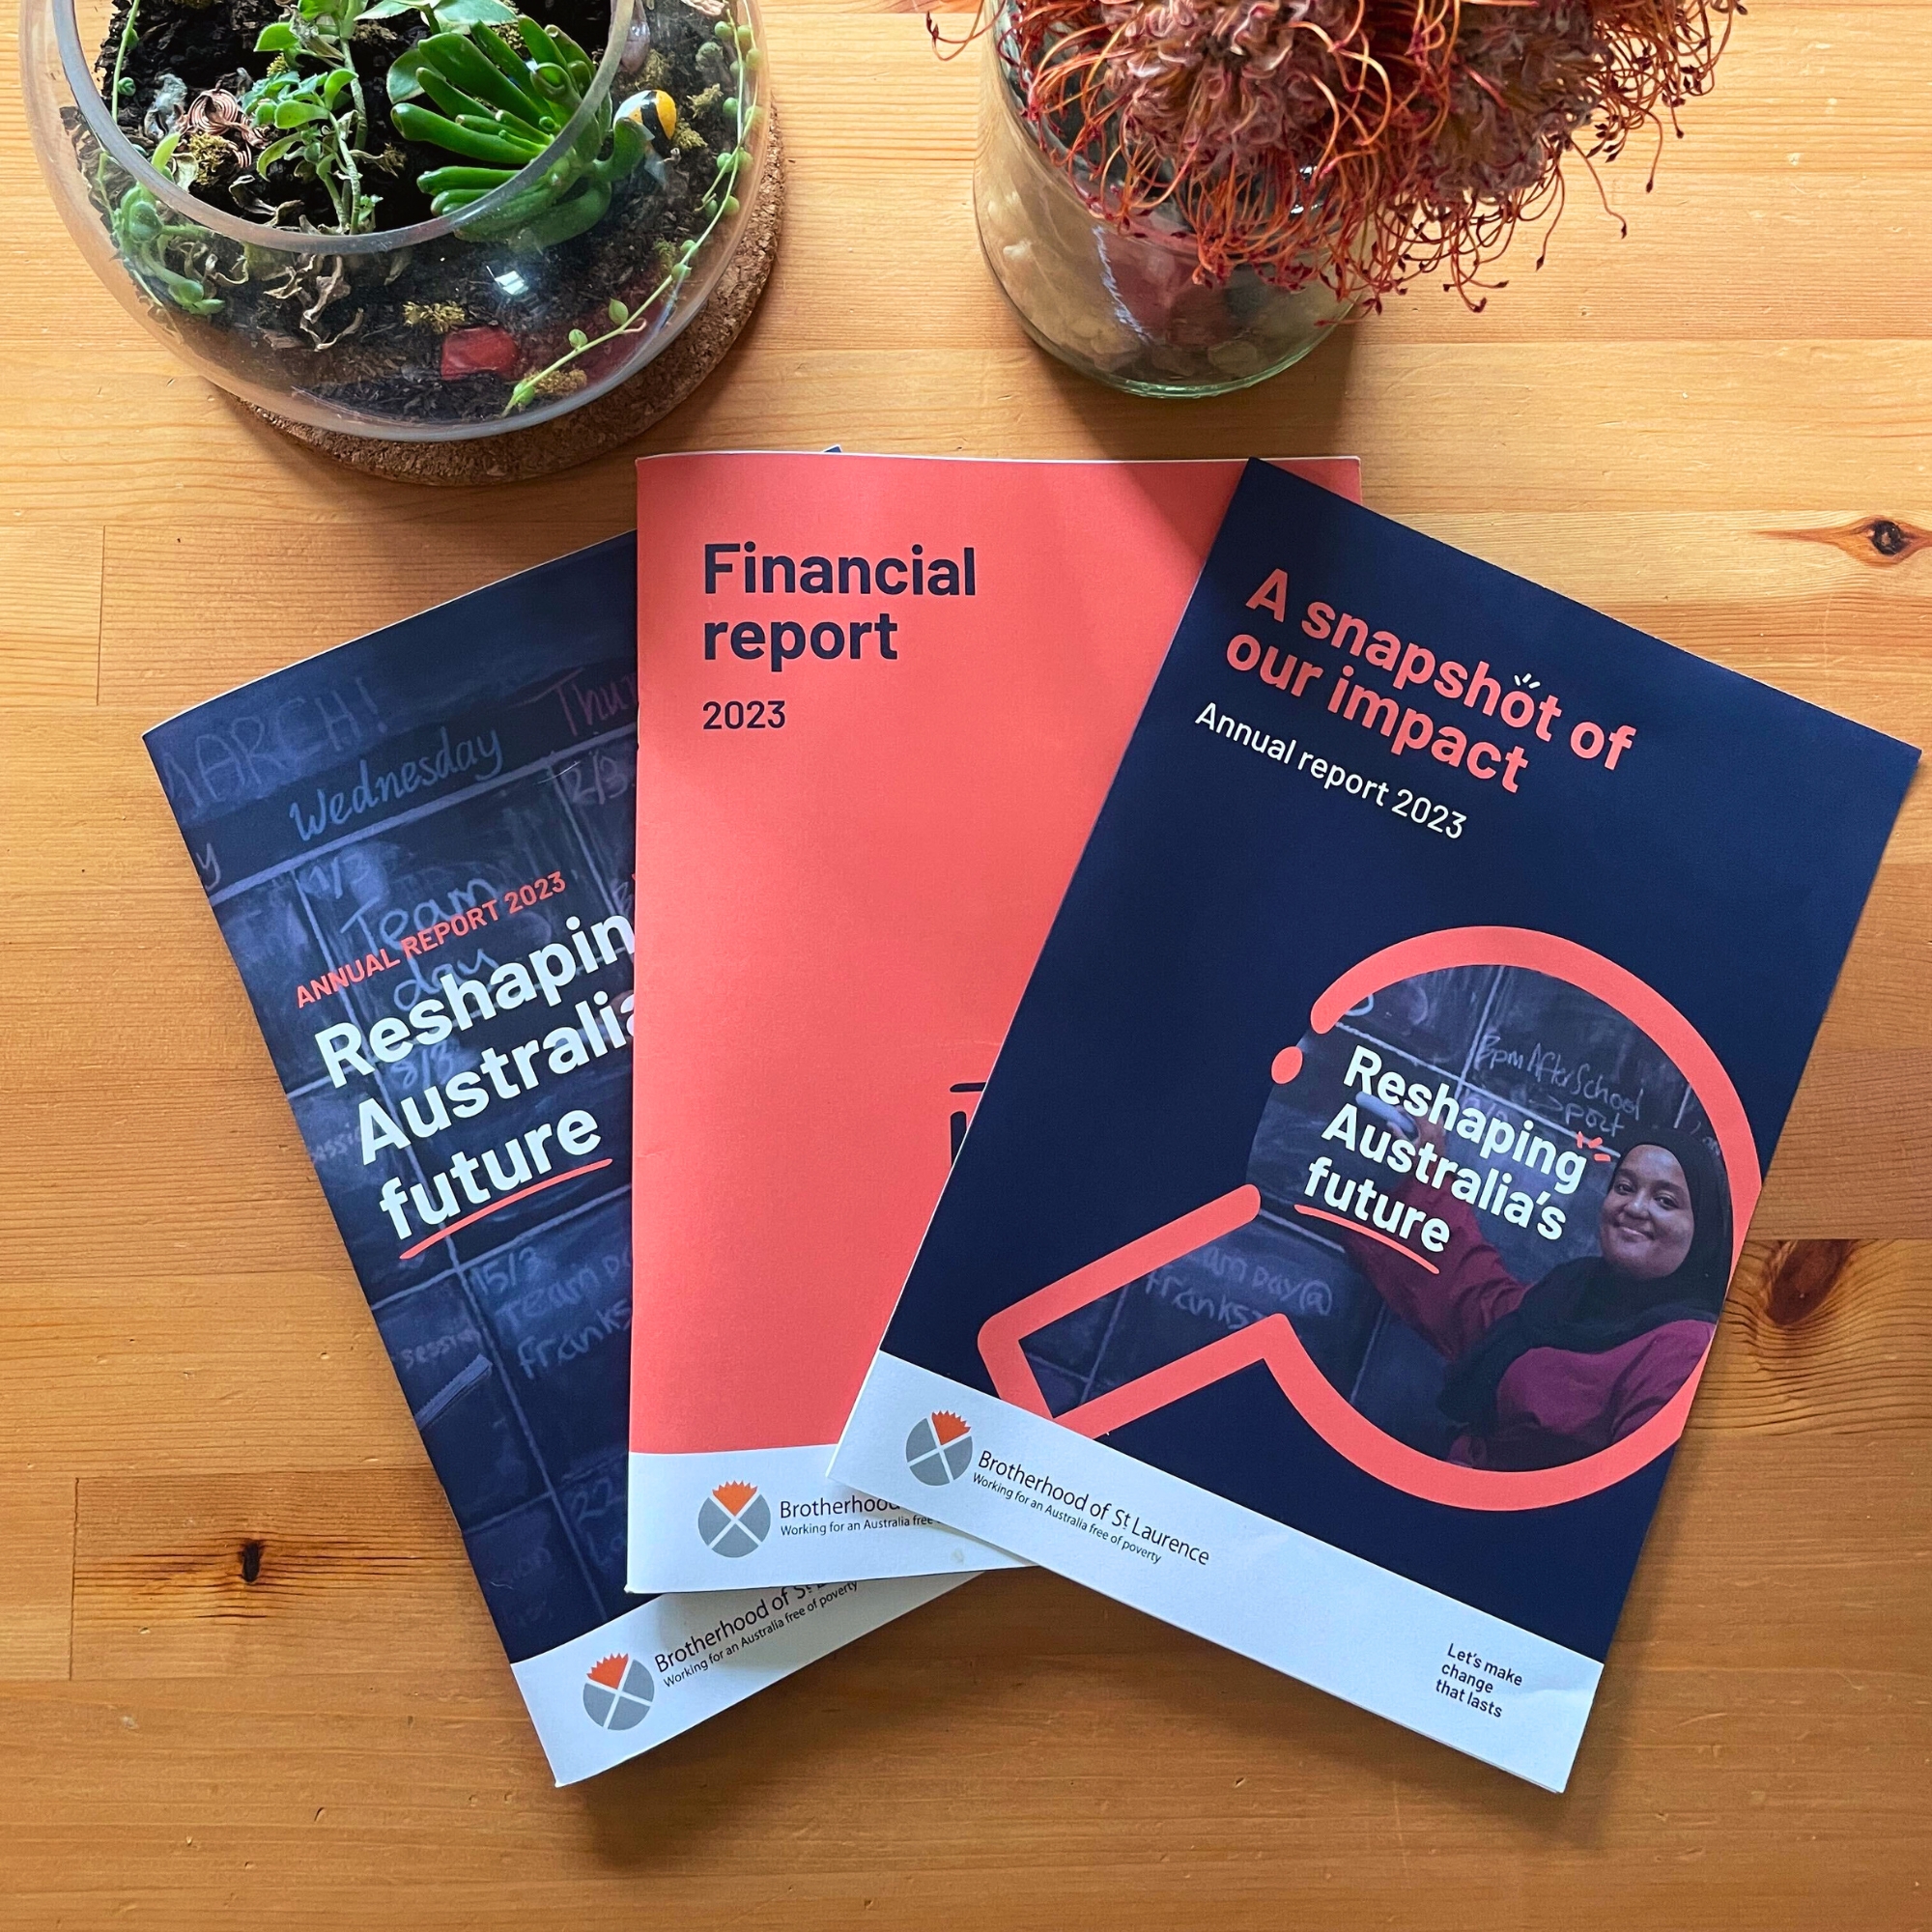
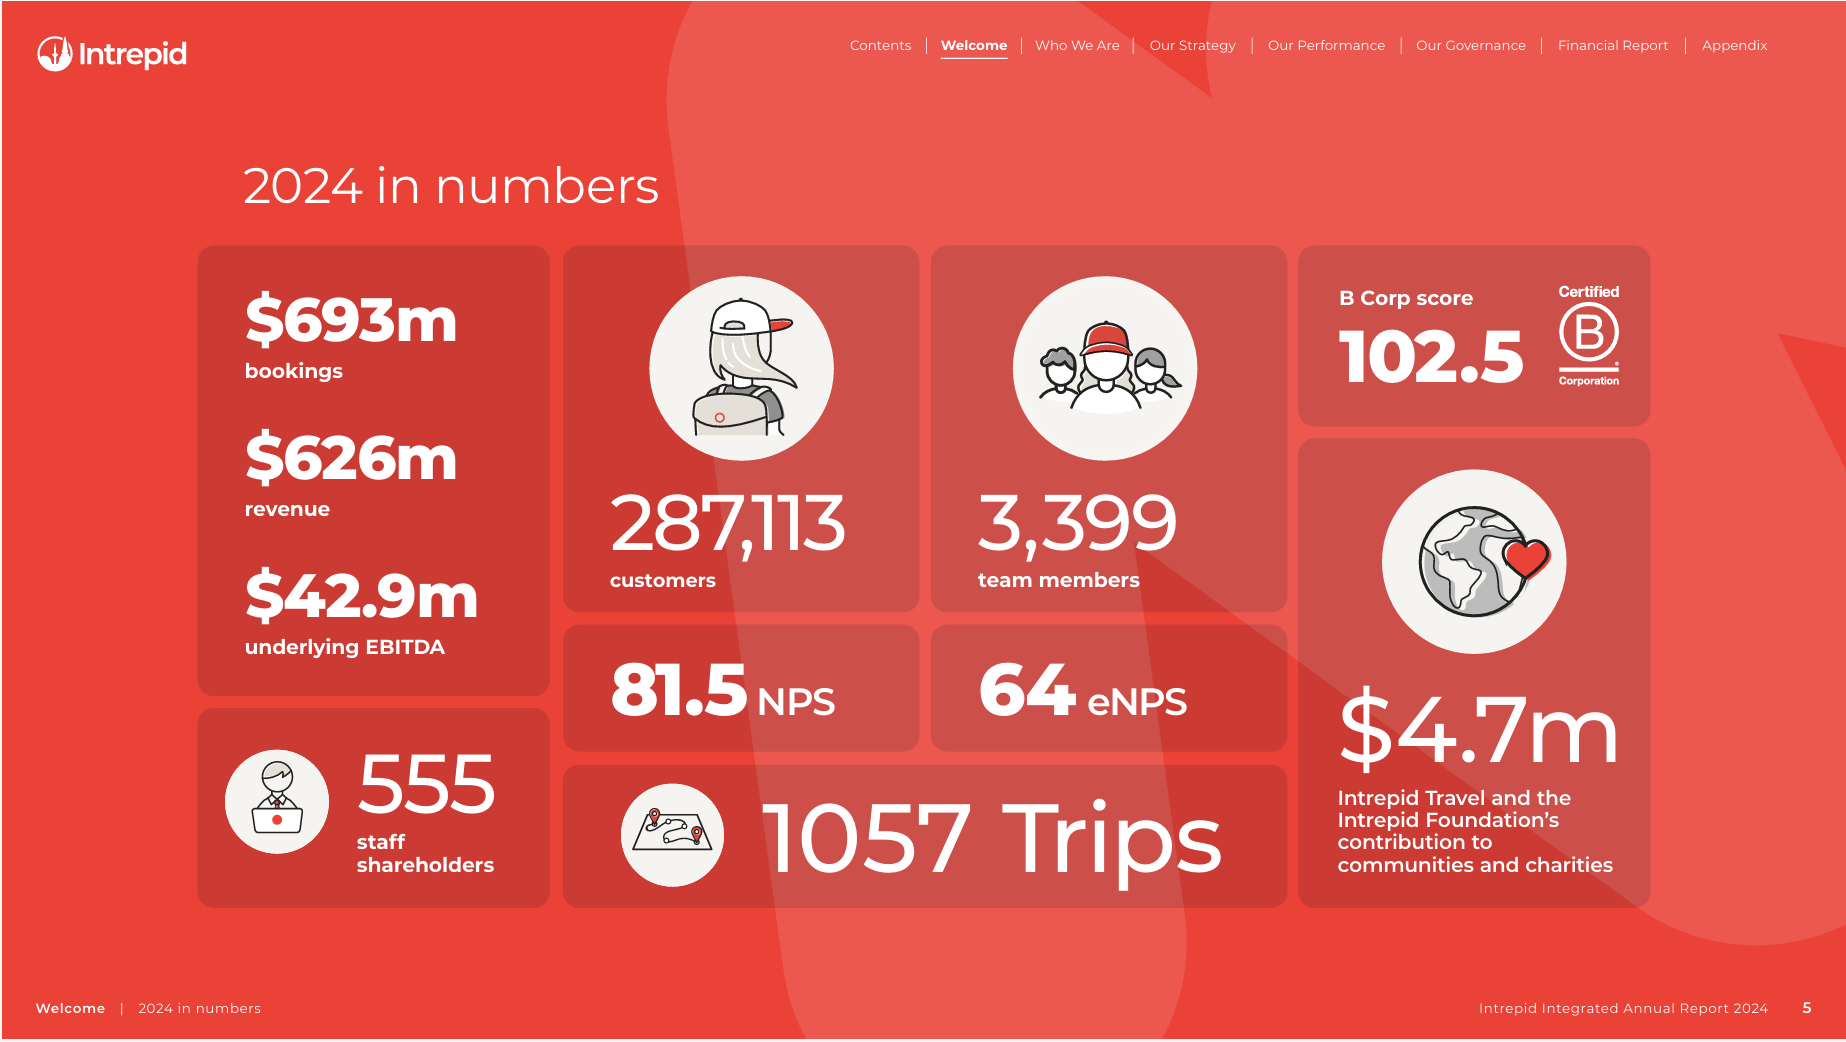
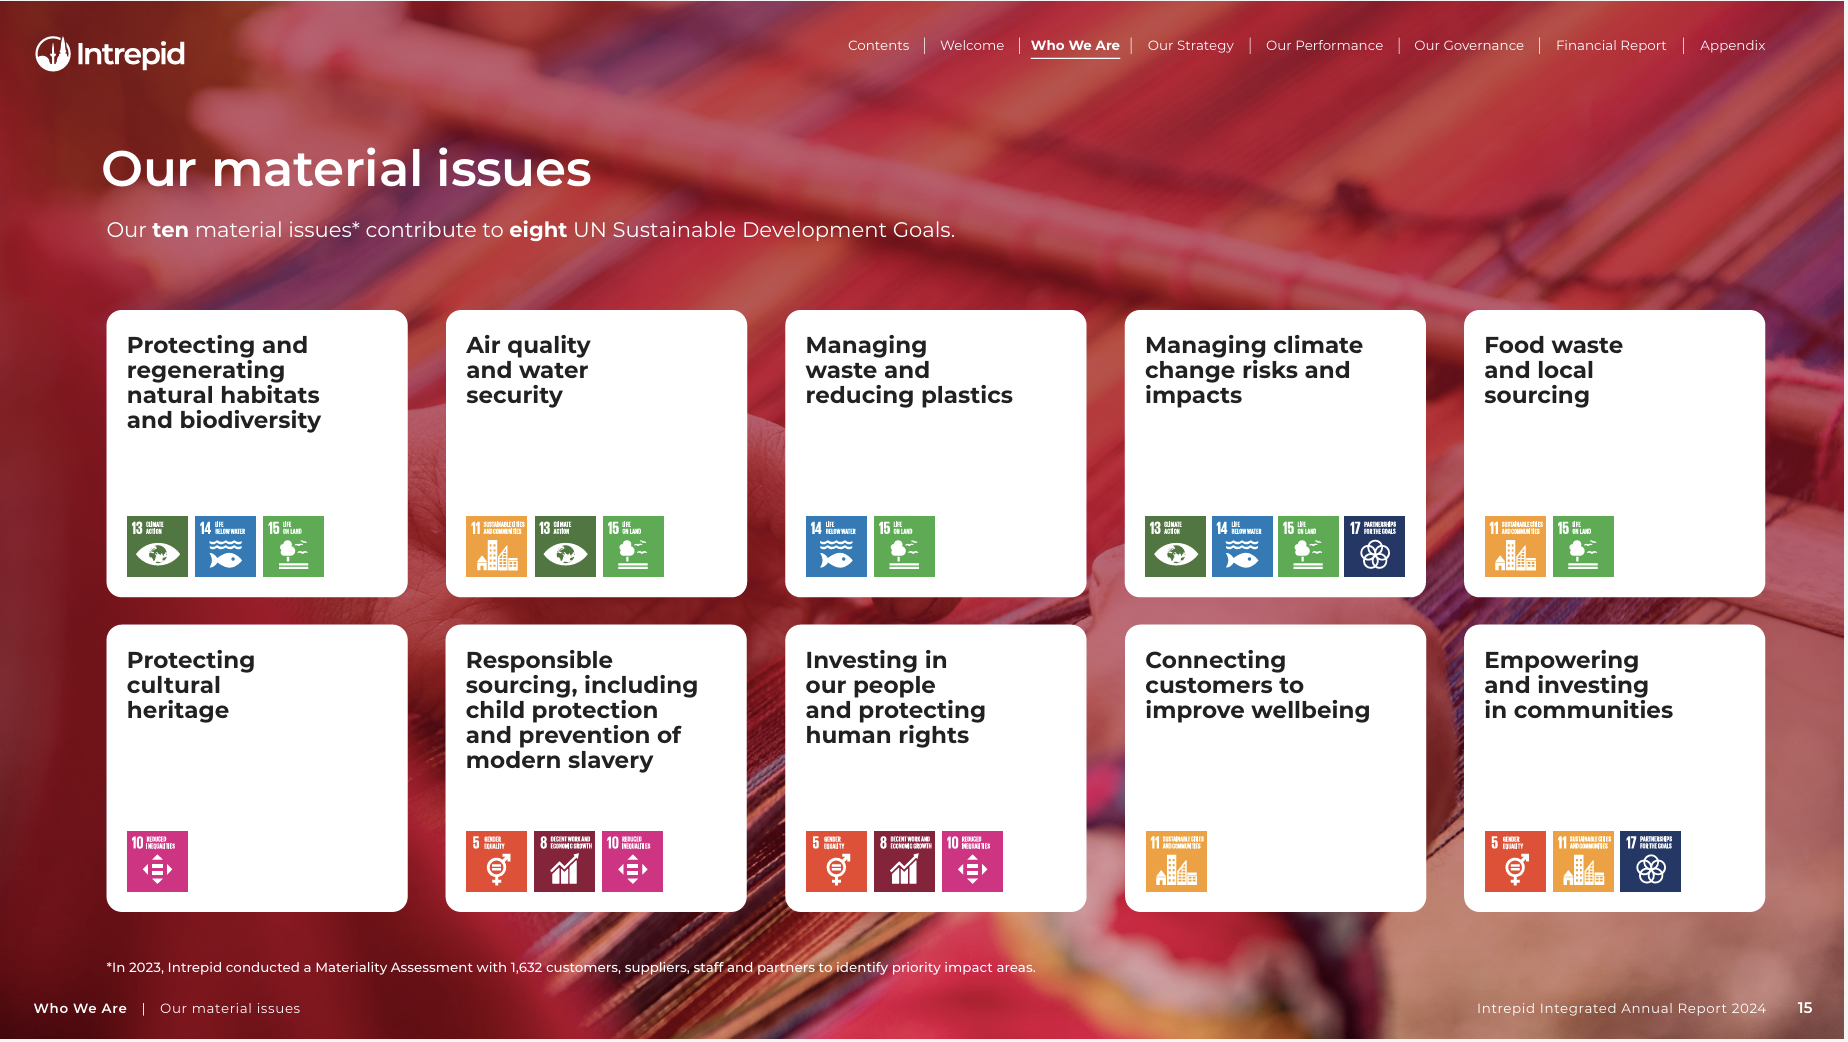
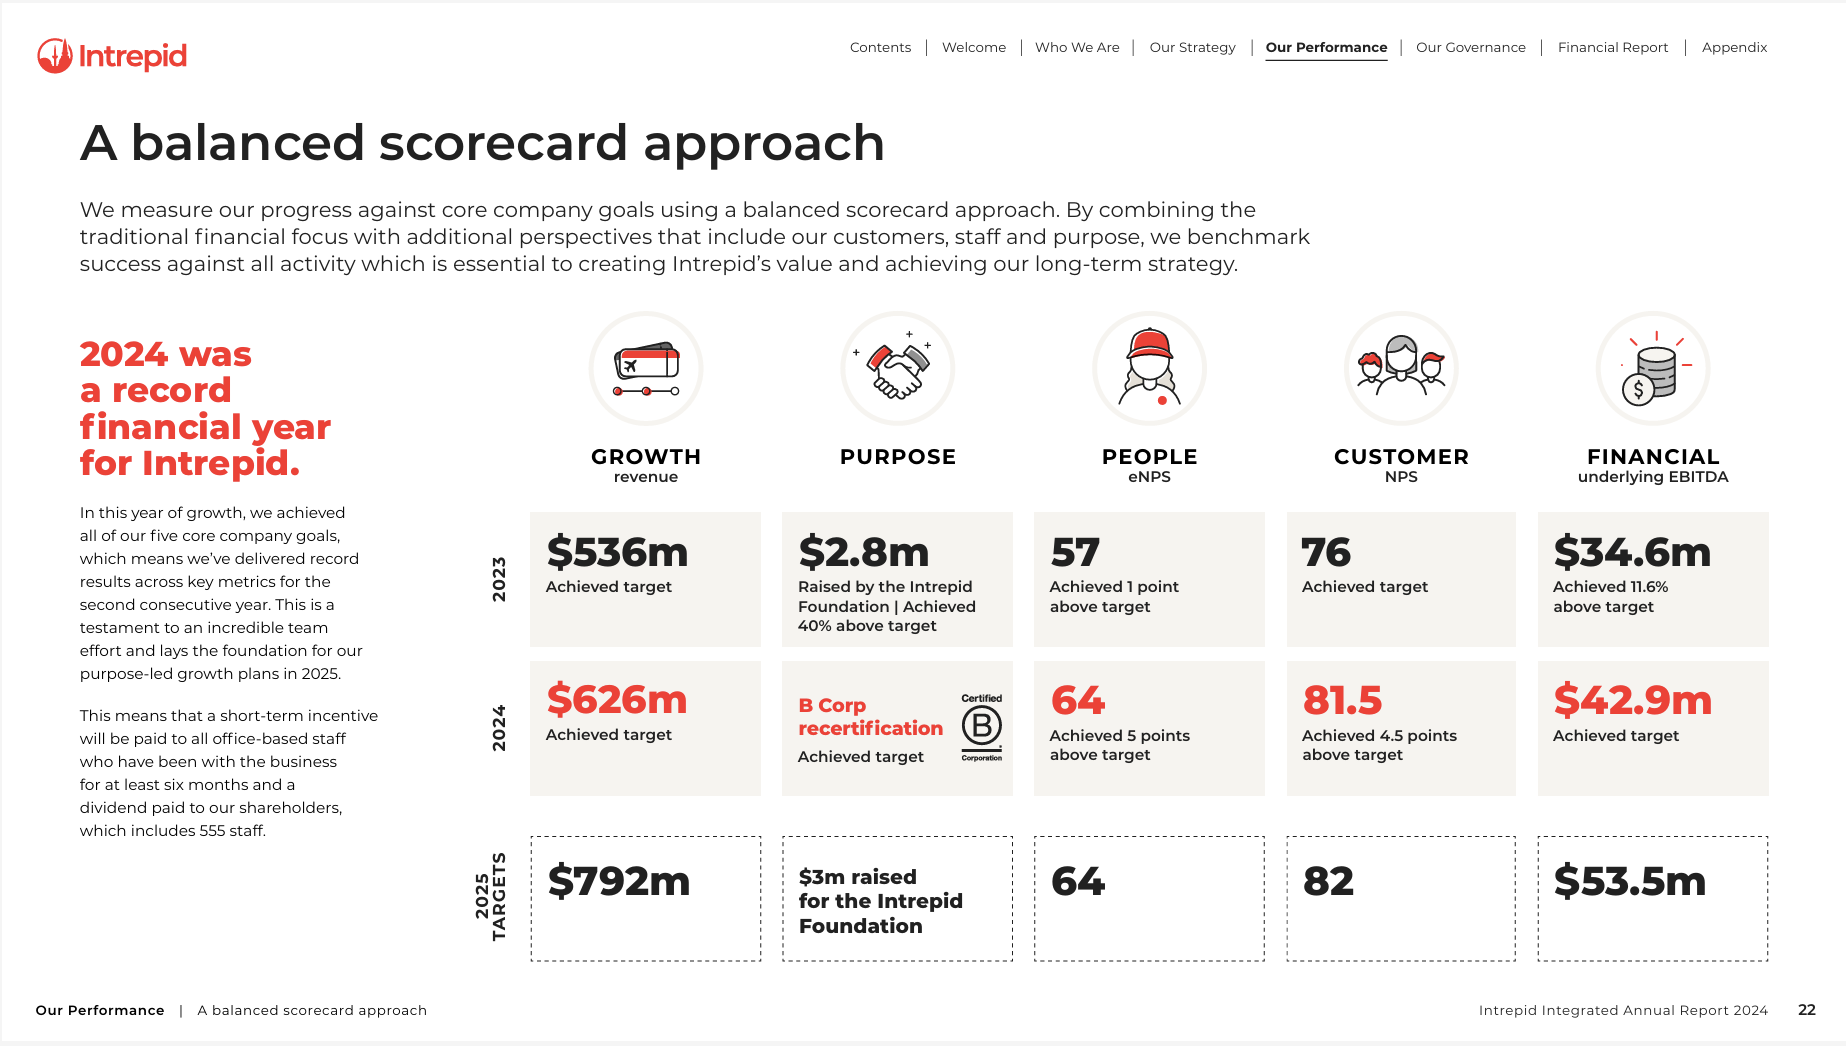
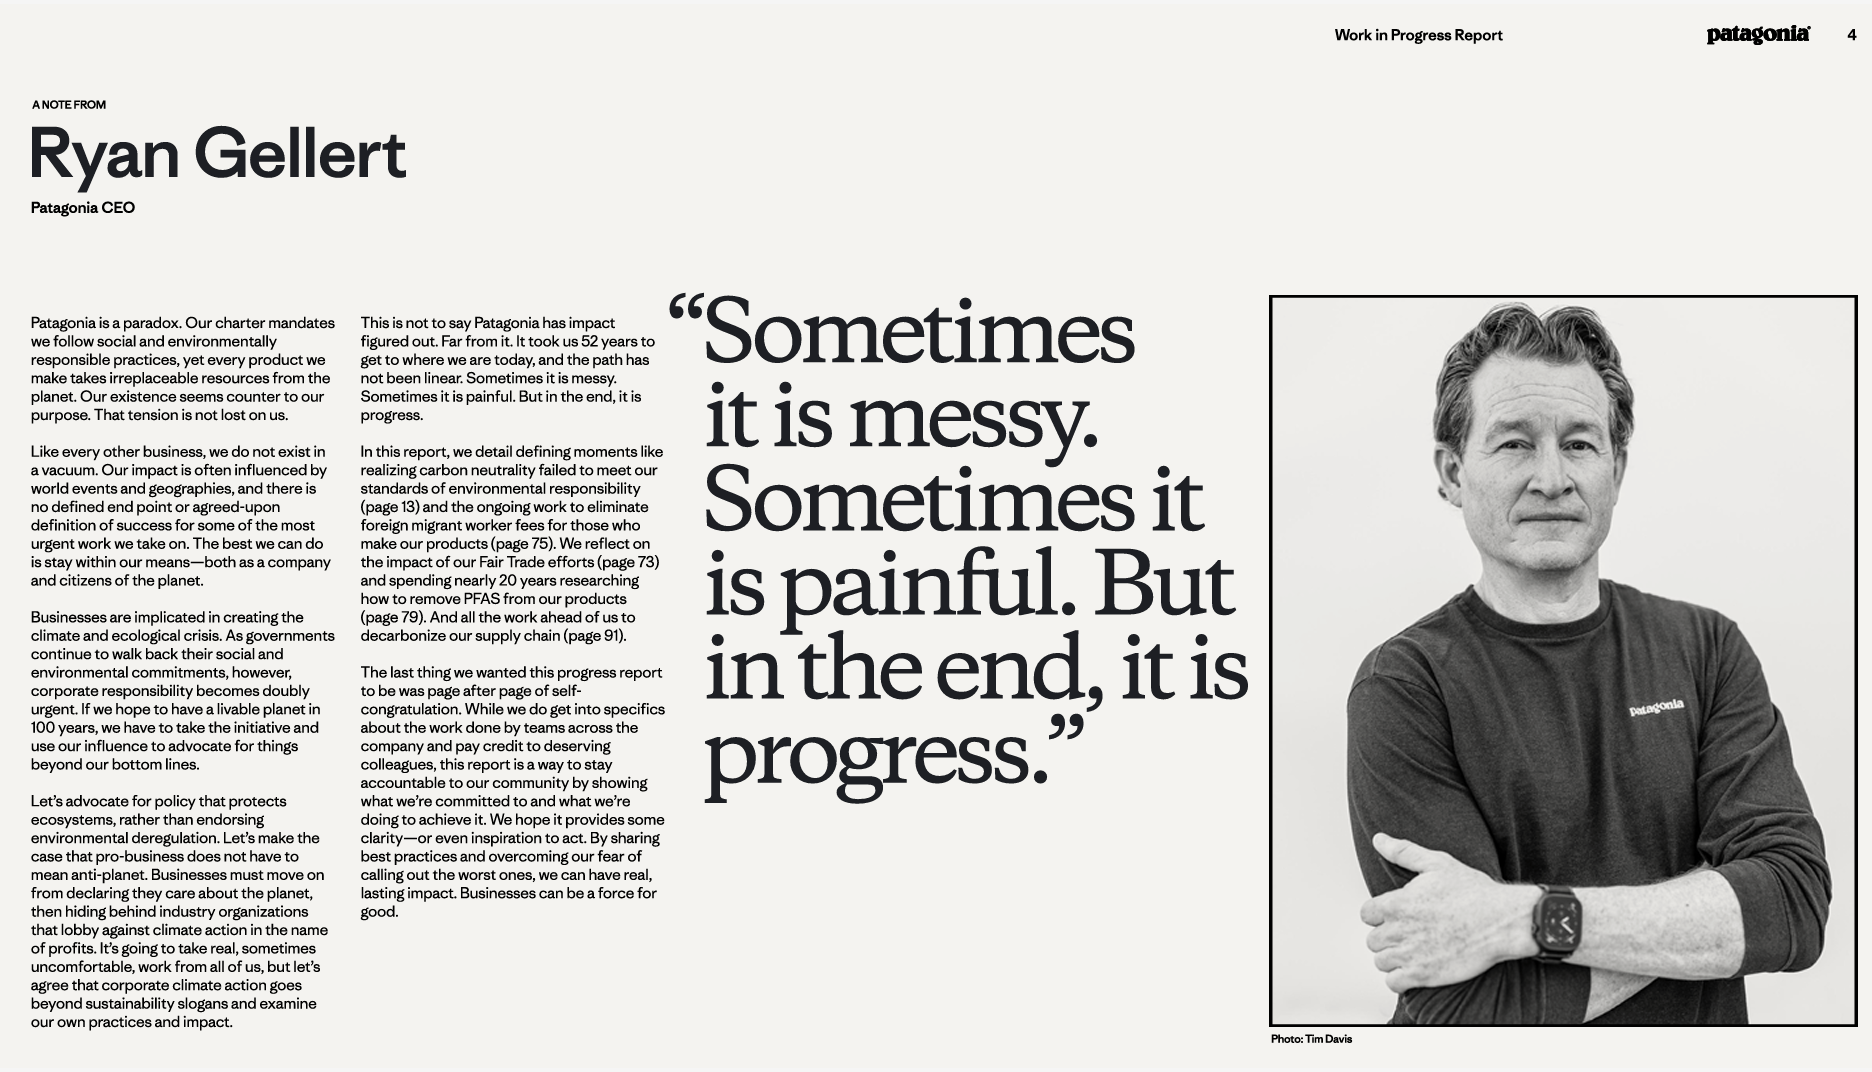
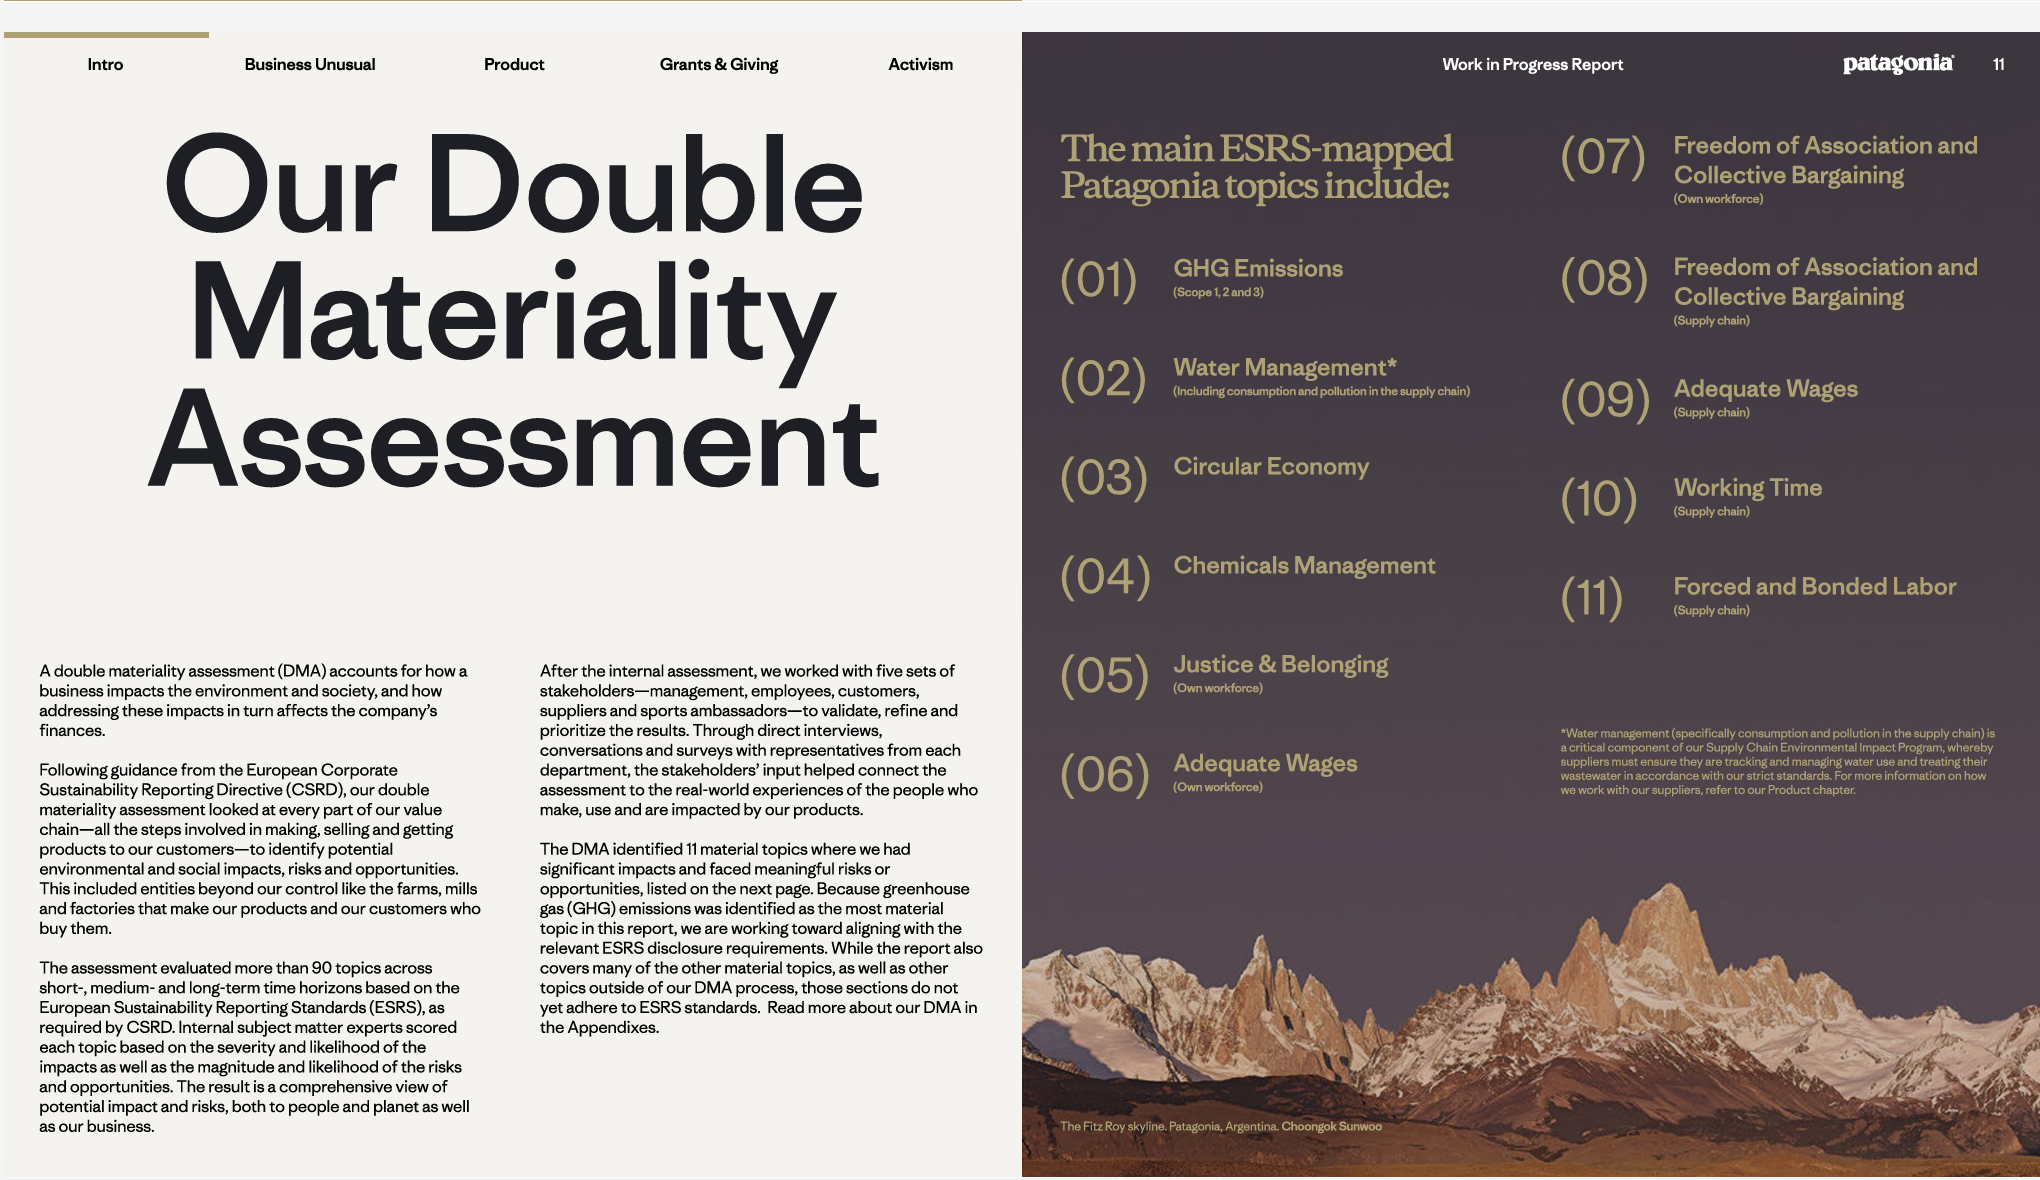
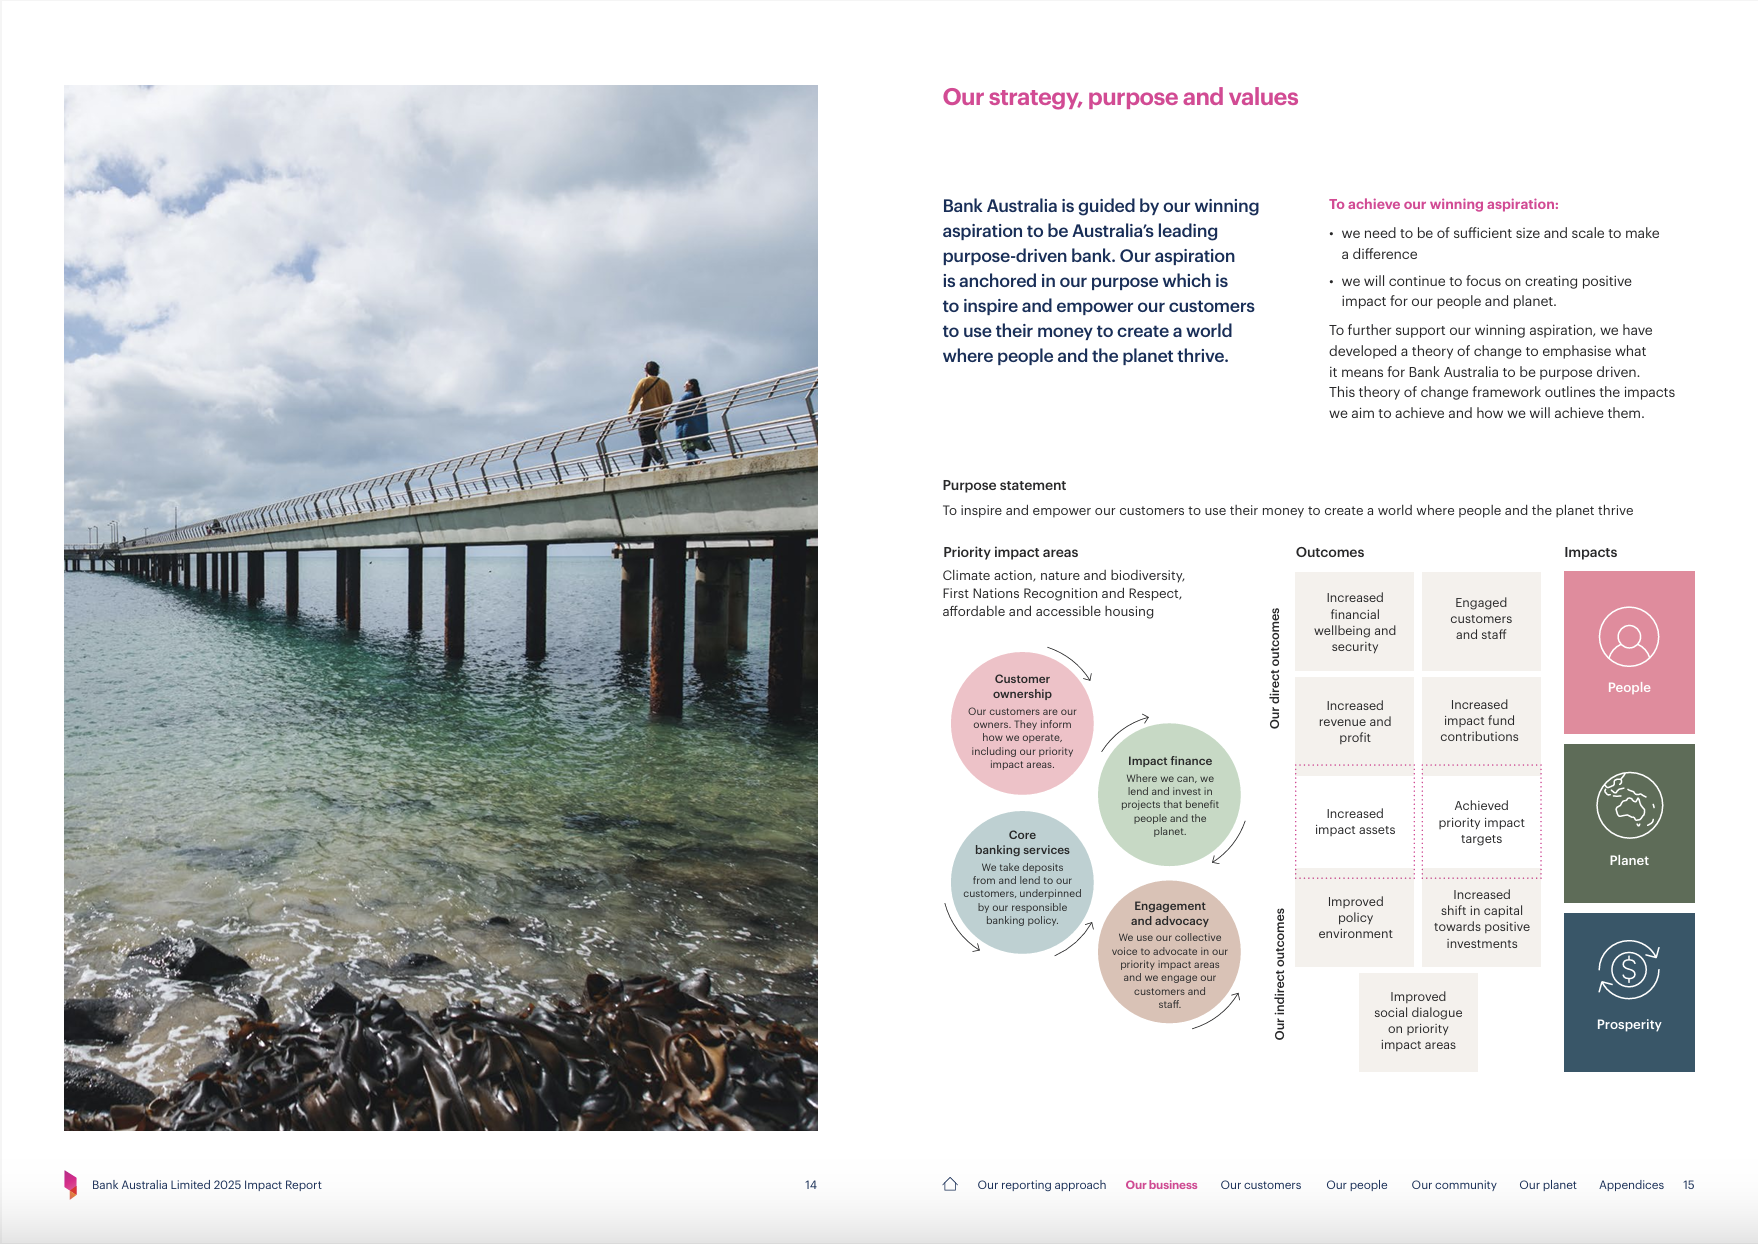
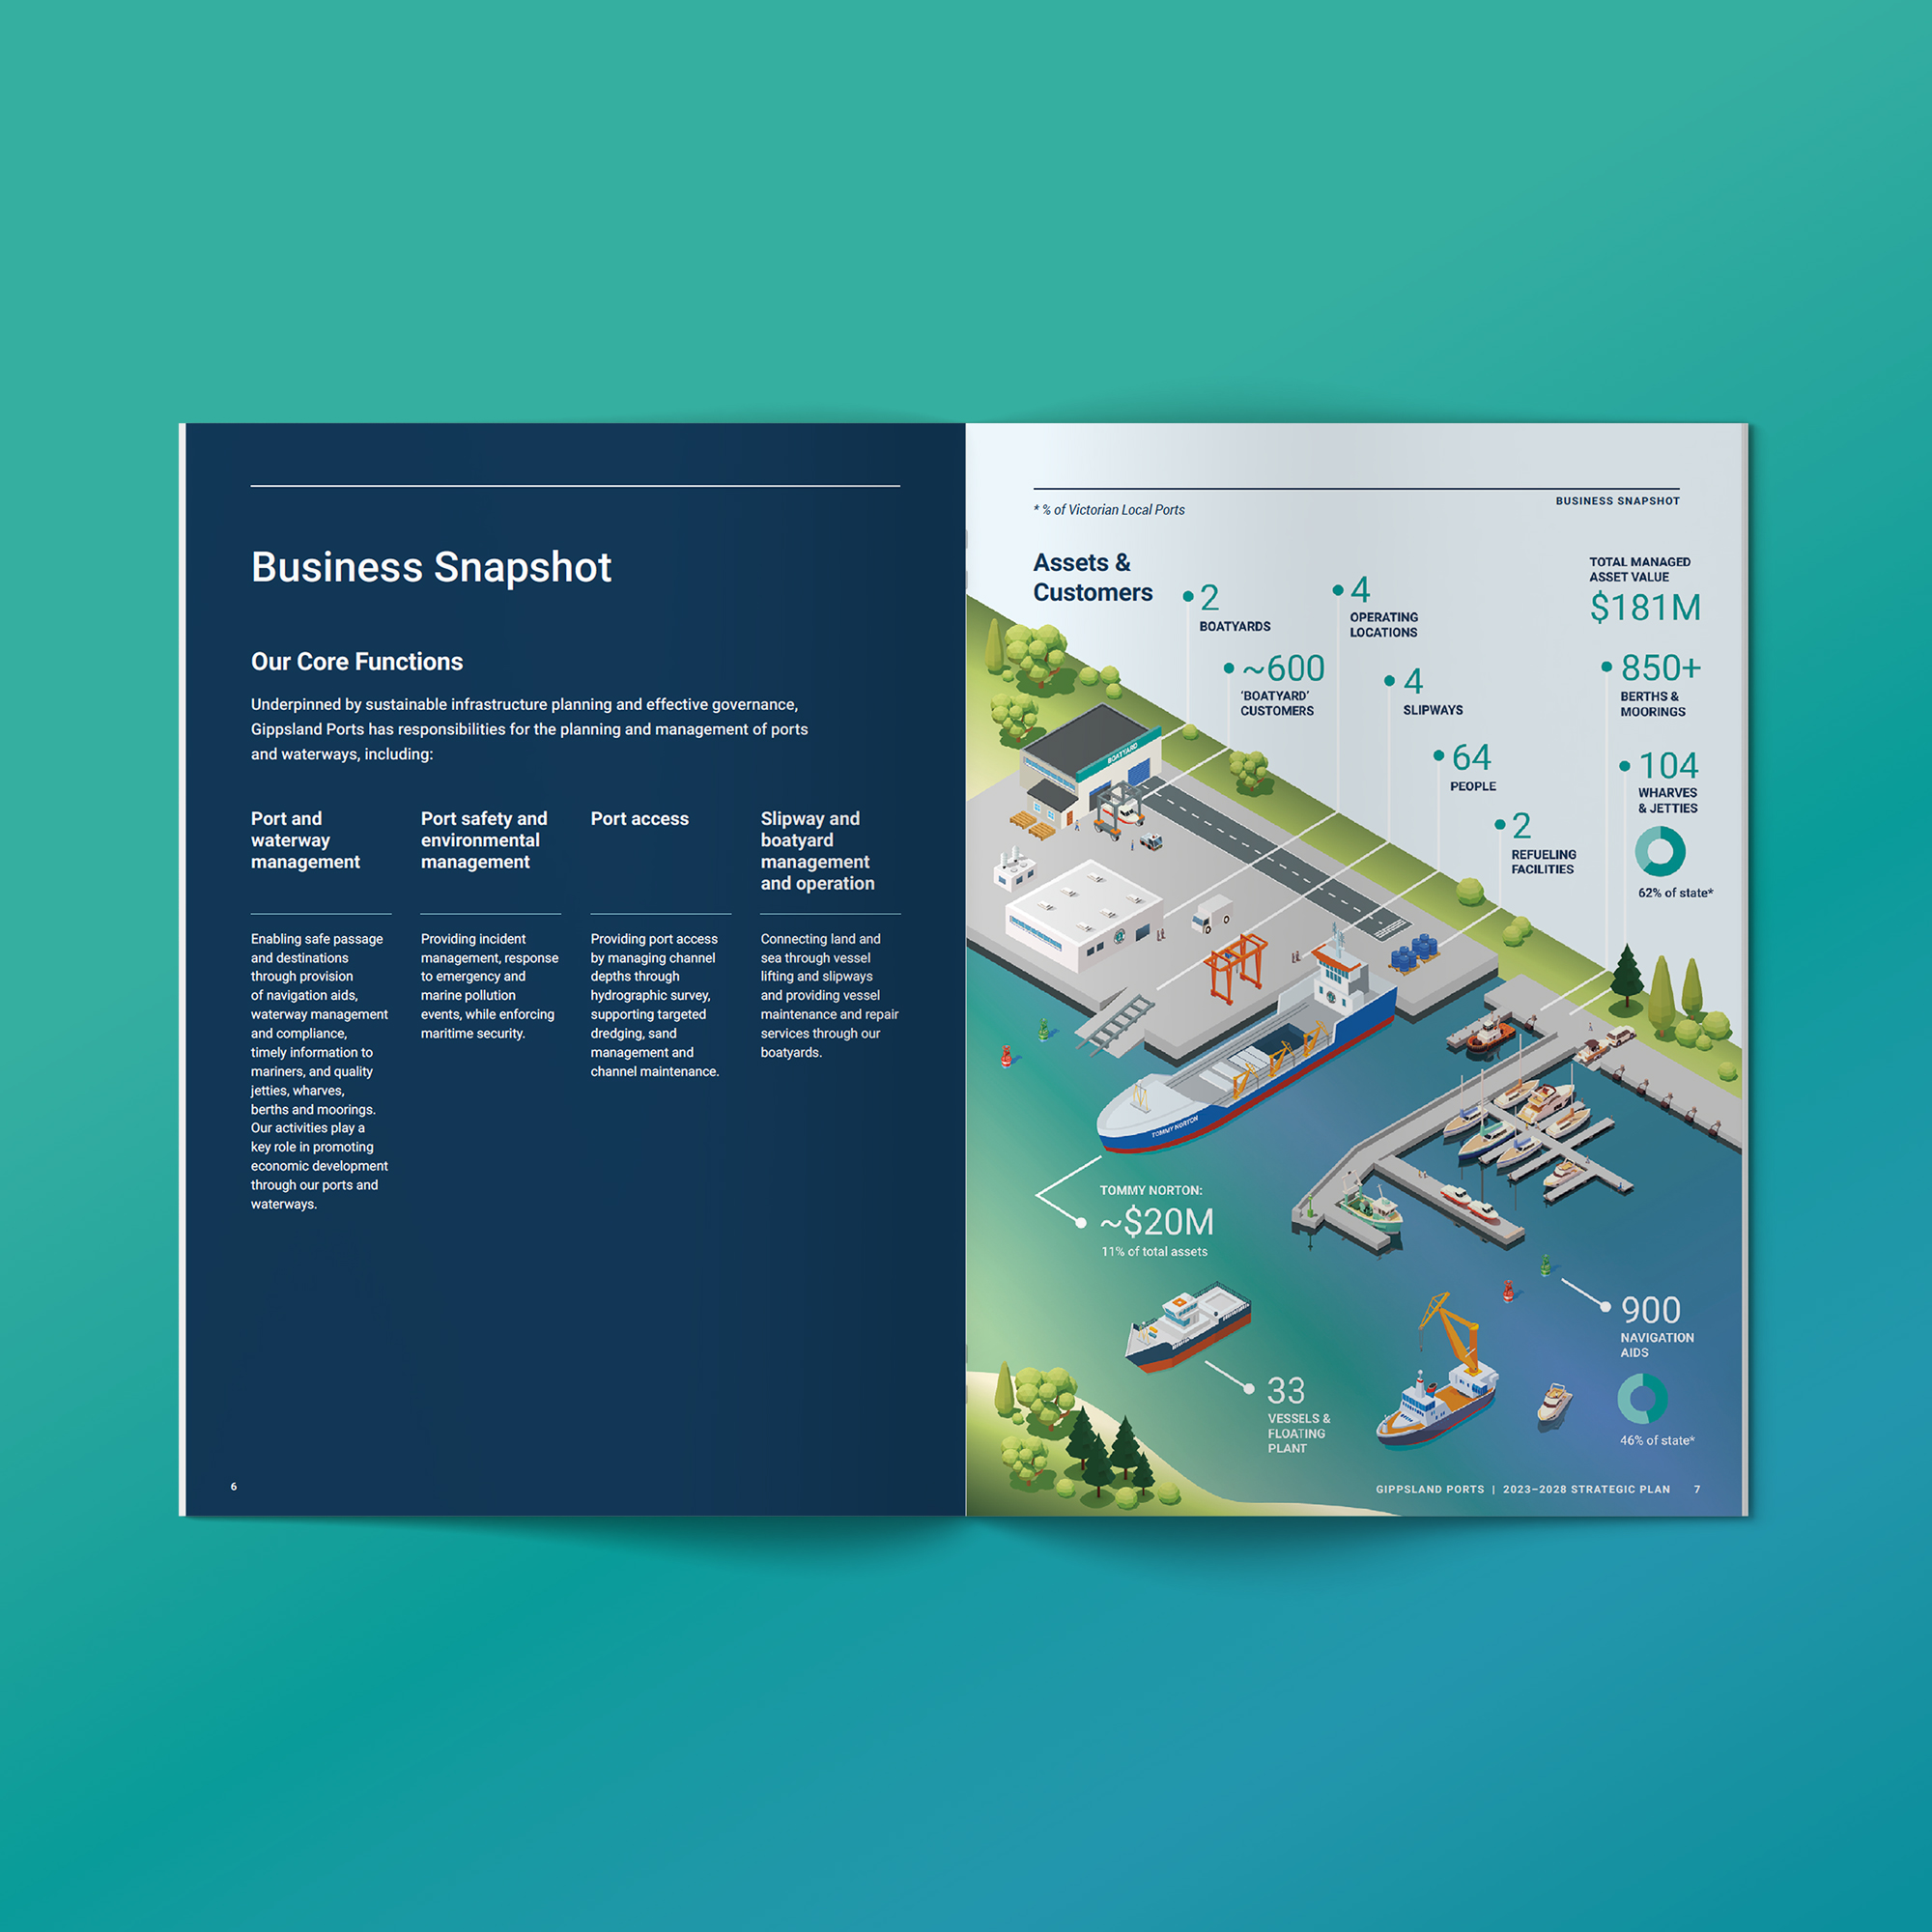
Rather than treating sustainability reports as separate documents, organisations are increasingly exploring integrated reporting models – where financial performance, environmental impact and social outcomes are presented together in a cohesive narrative. This approach combines financial performance with detailed sustainability reporting and ESG disclosures within a single annual or impact report. See some examples below:
- Intrepid Travel Integrated Annual Report 2024
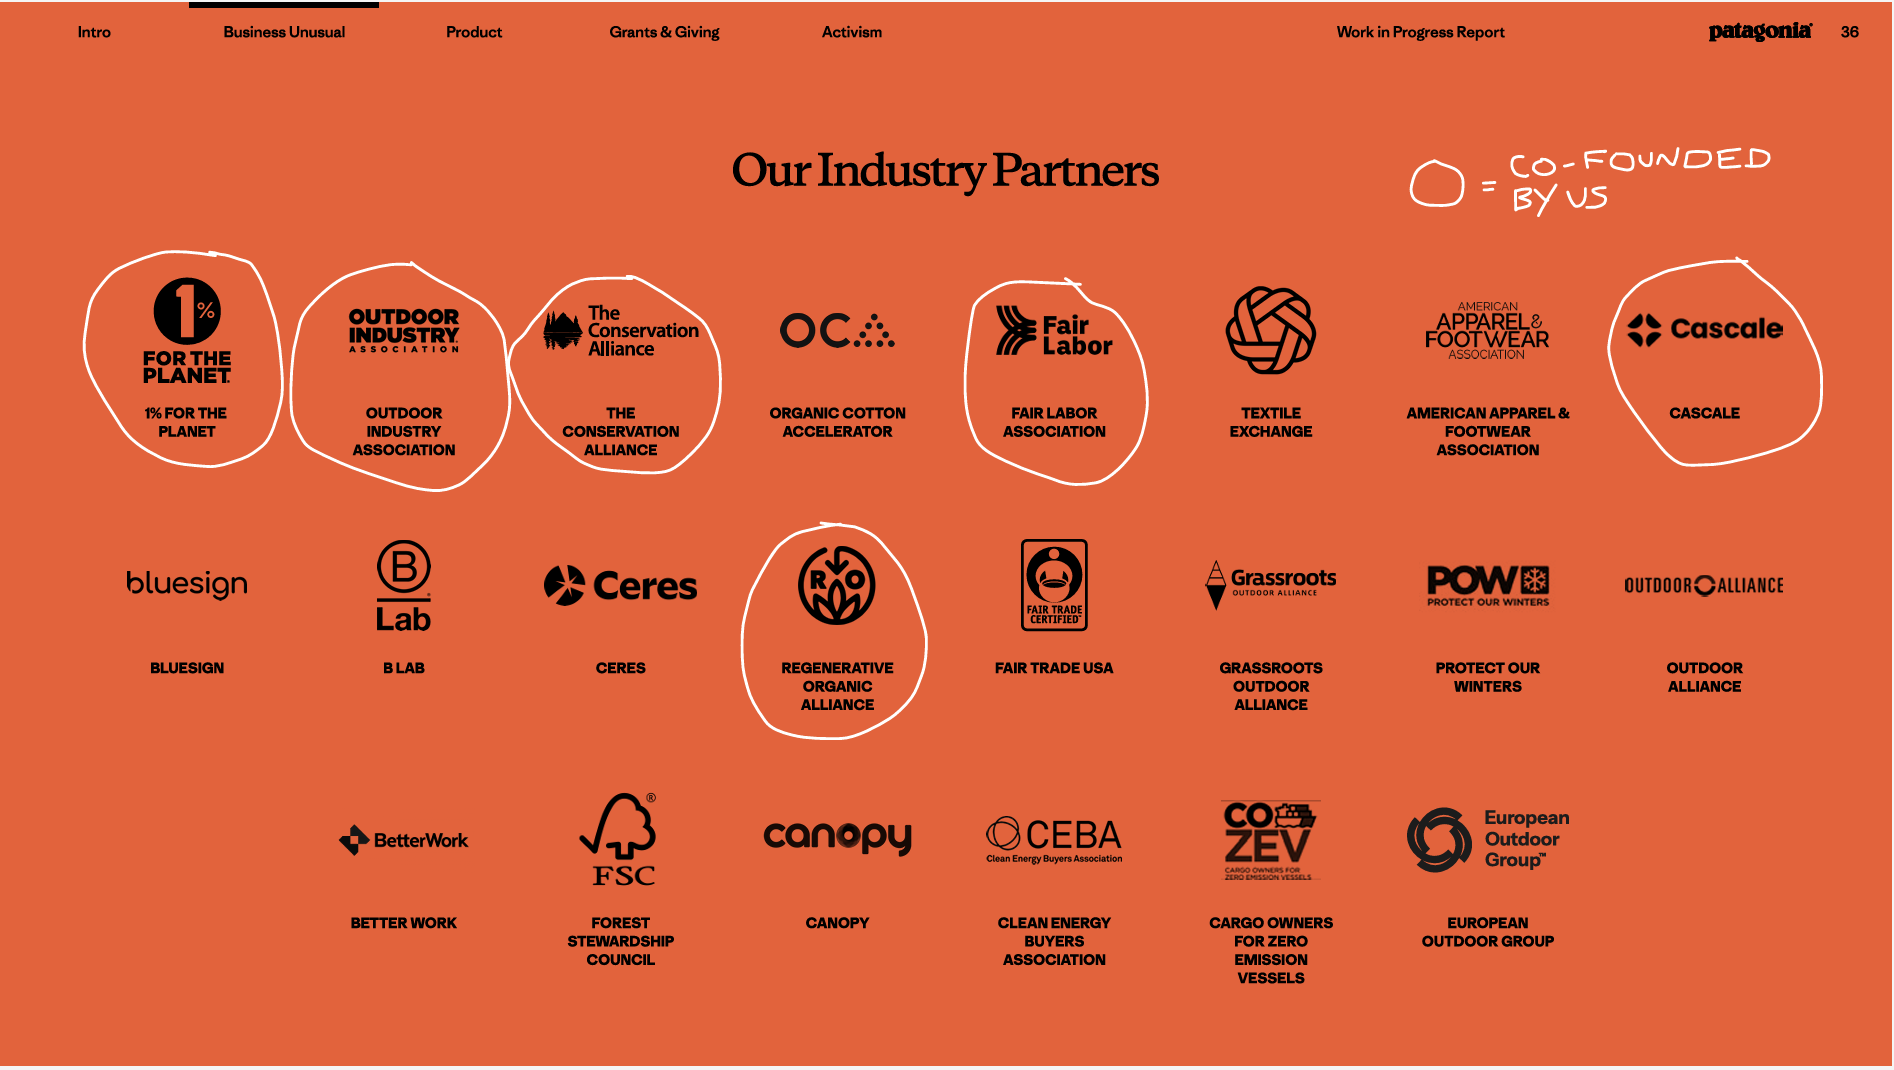
- Patagonia B Corp Impact Report 2025
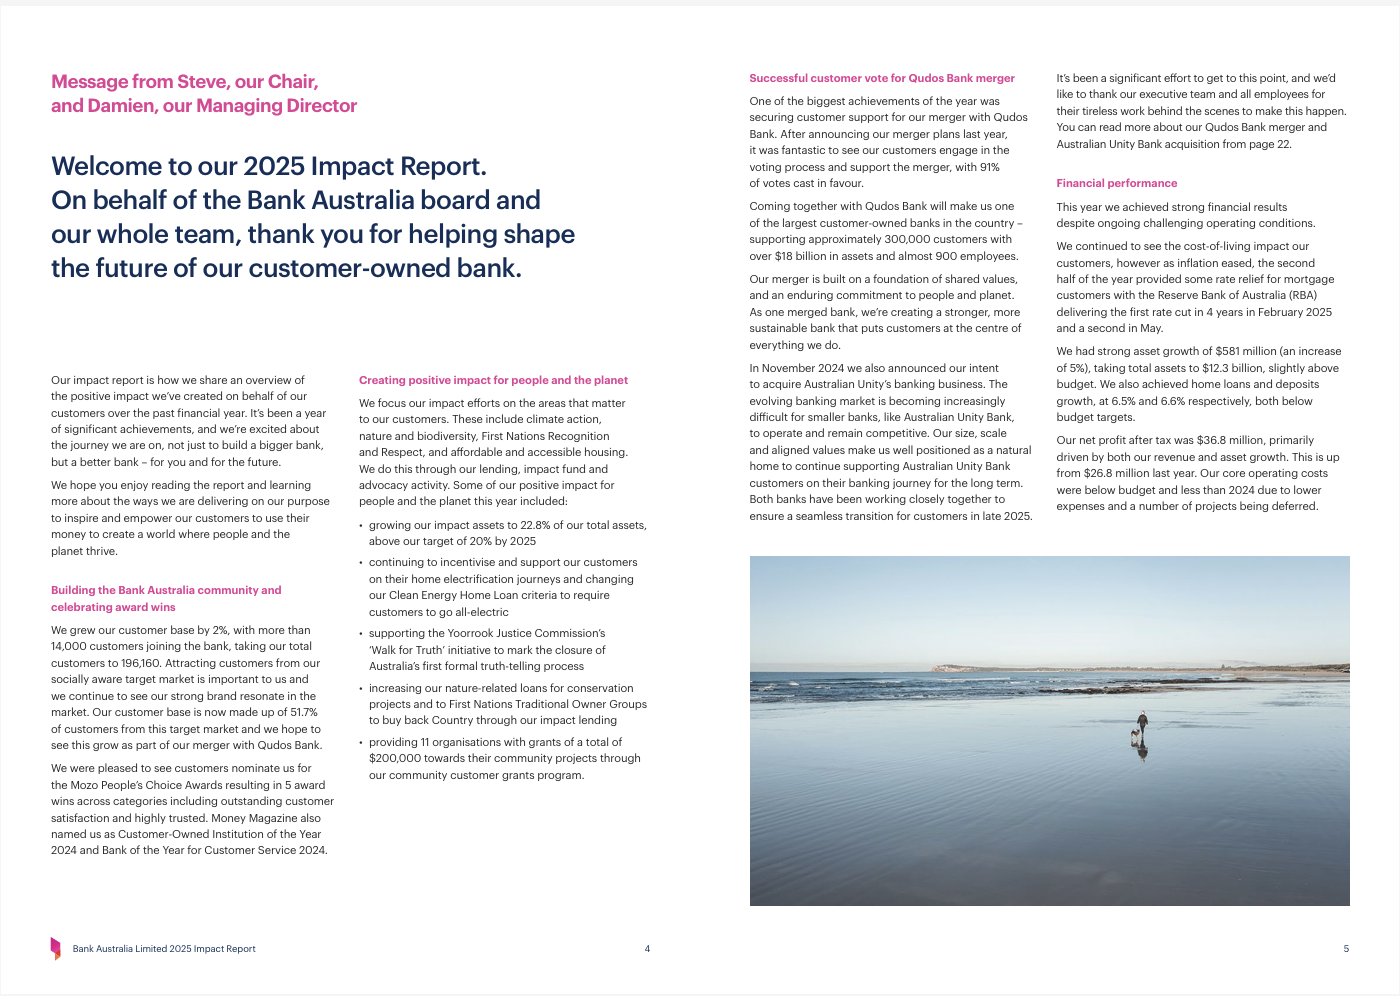
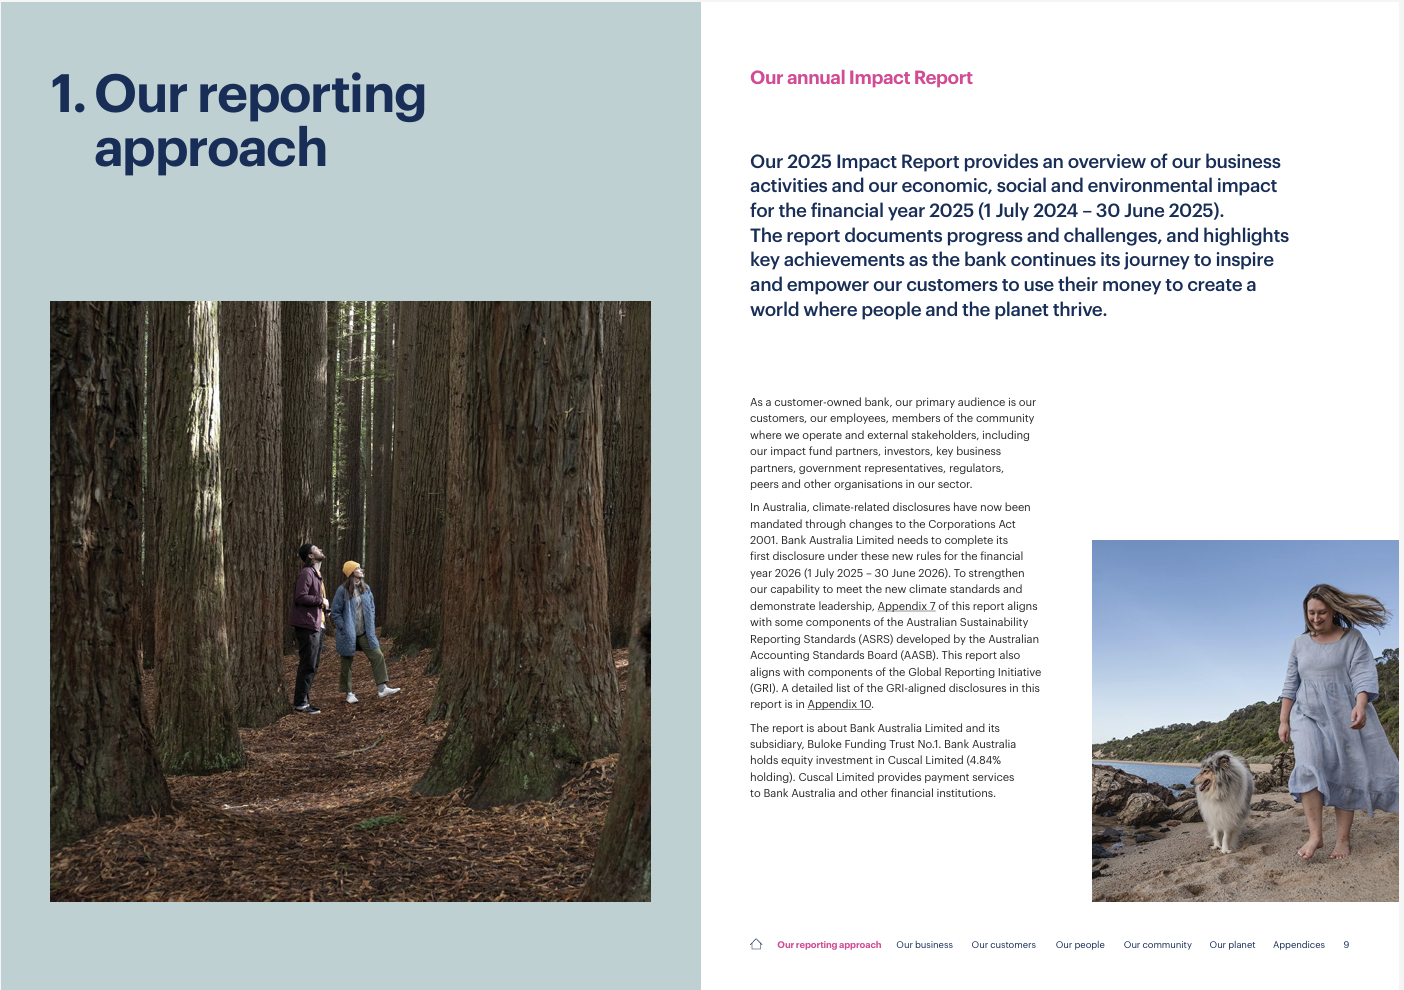
- Bank Australia 2025 Impact Report

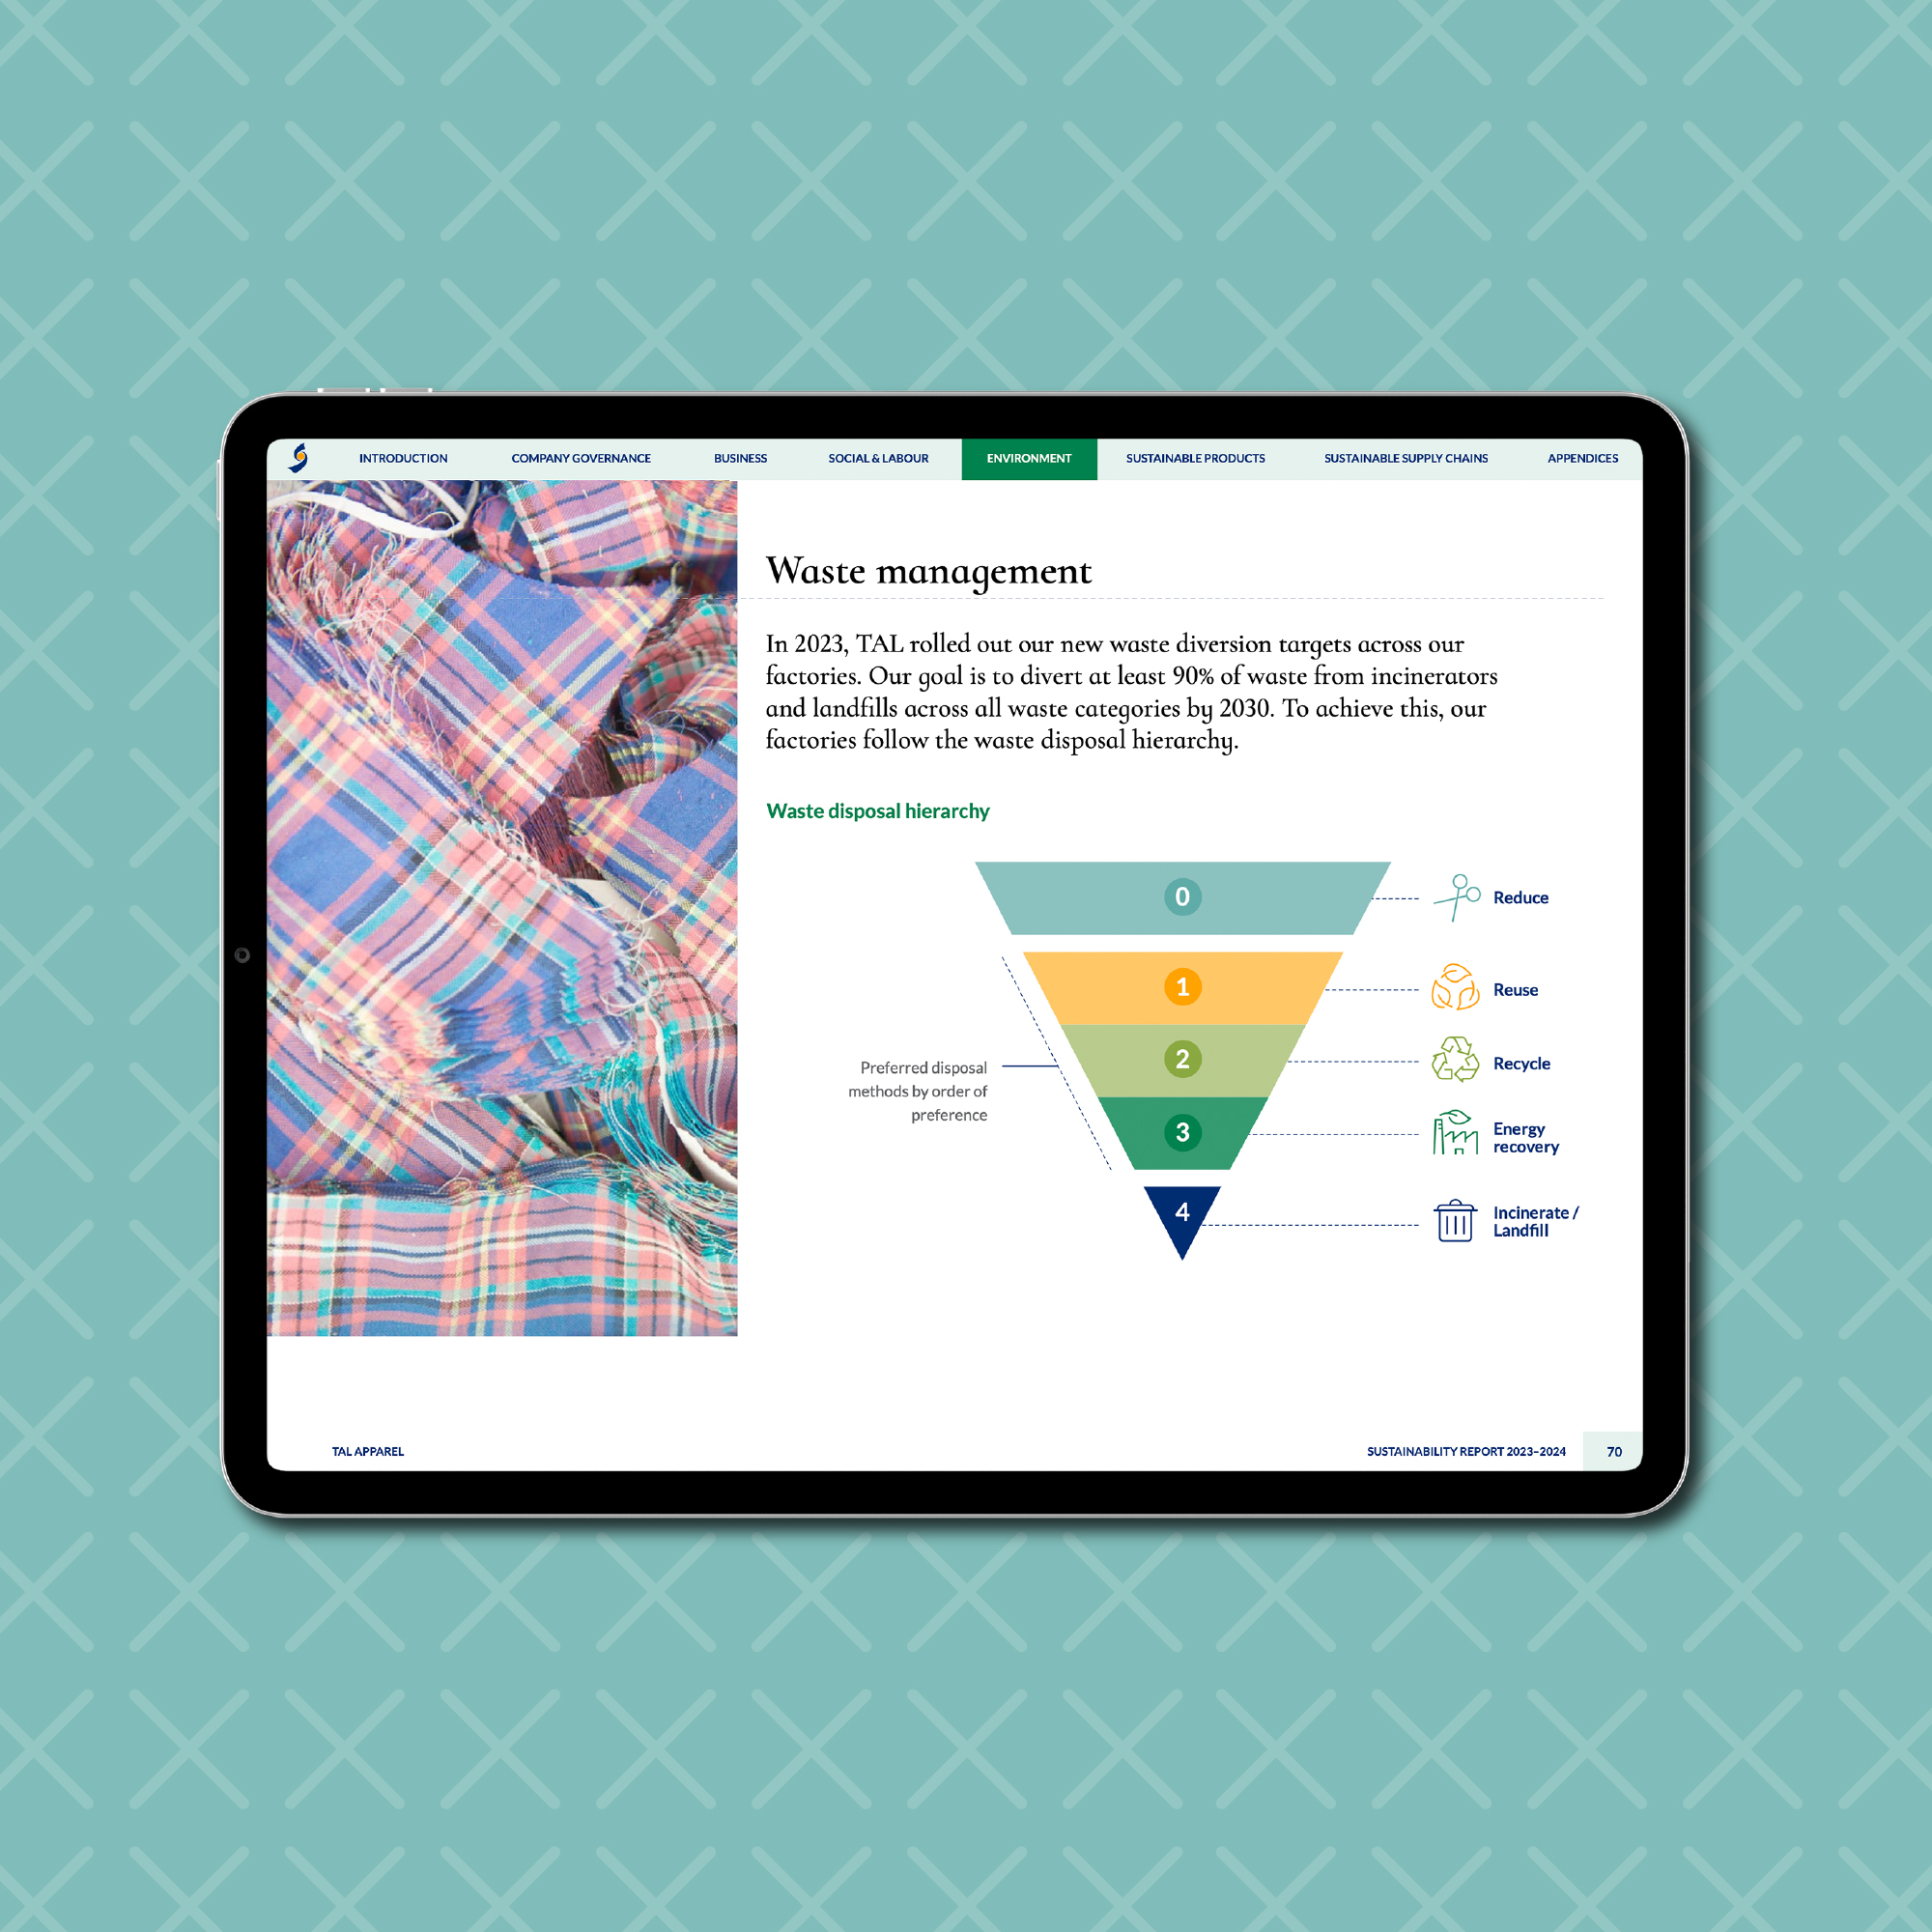
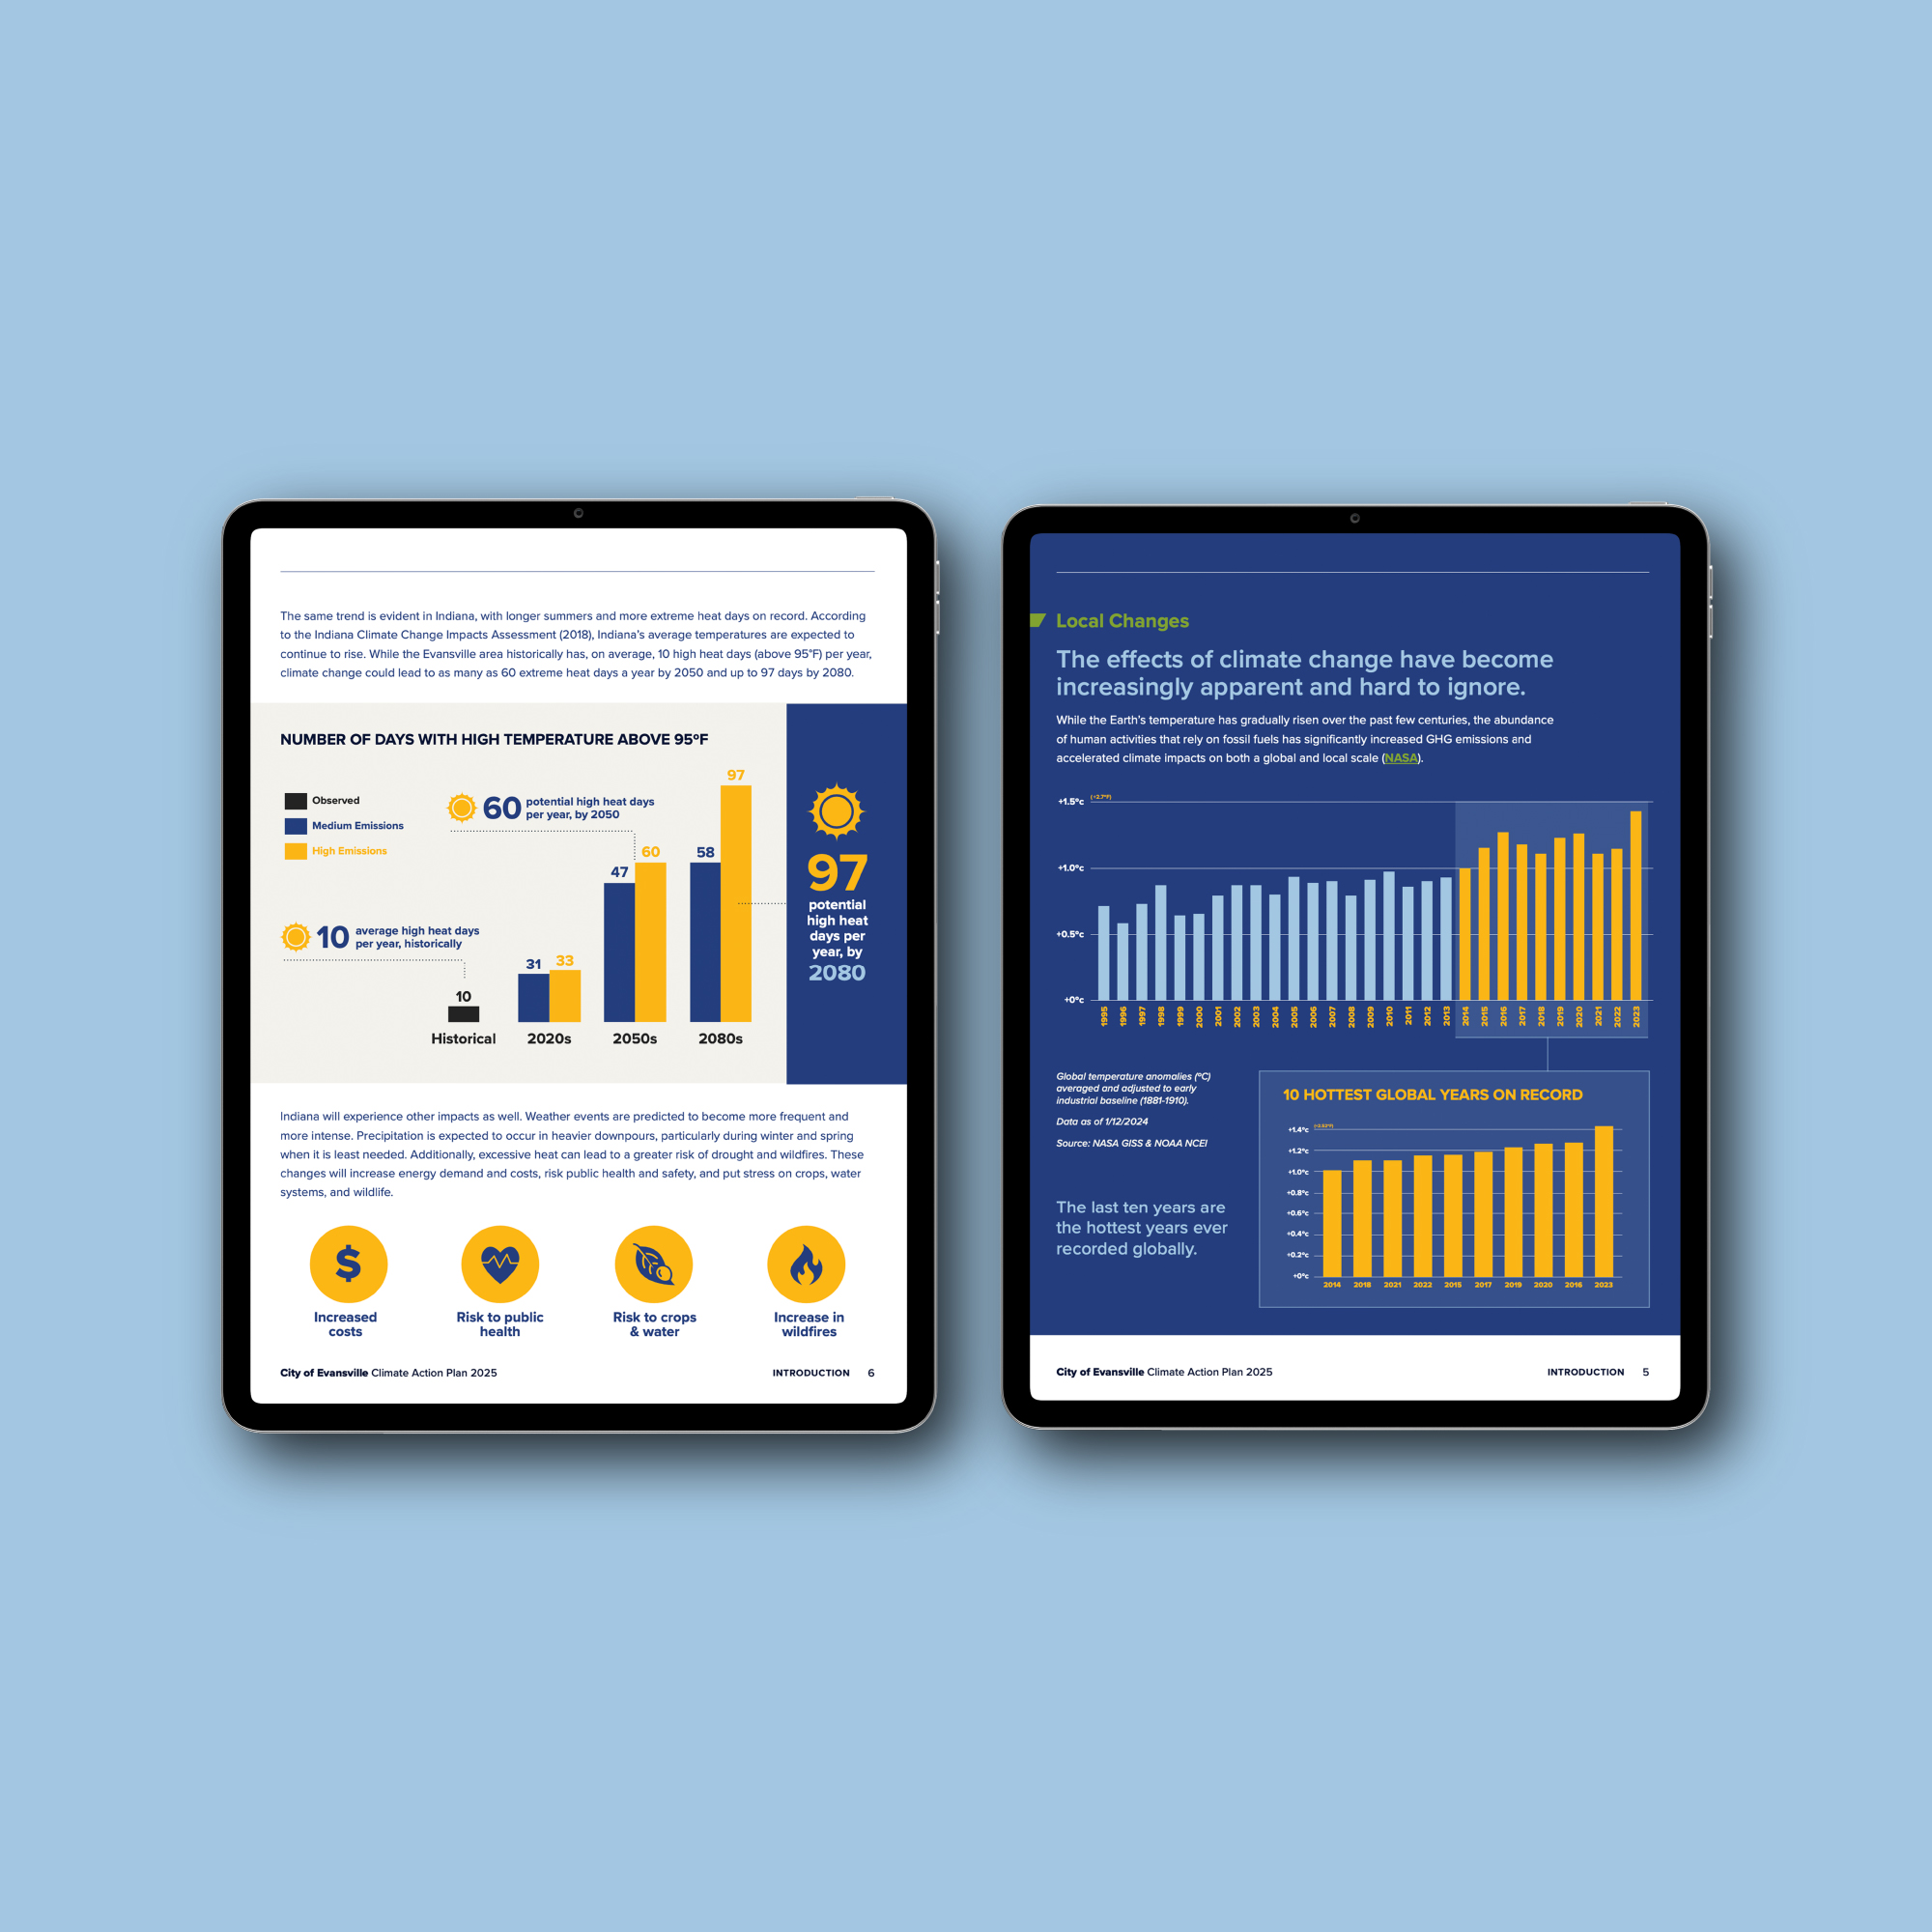
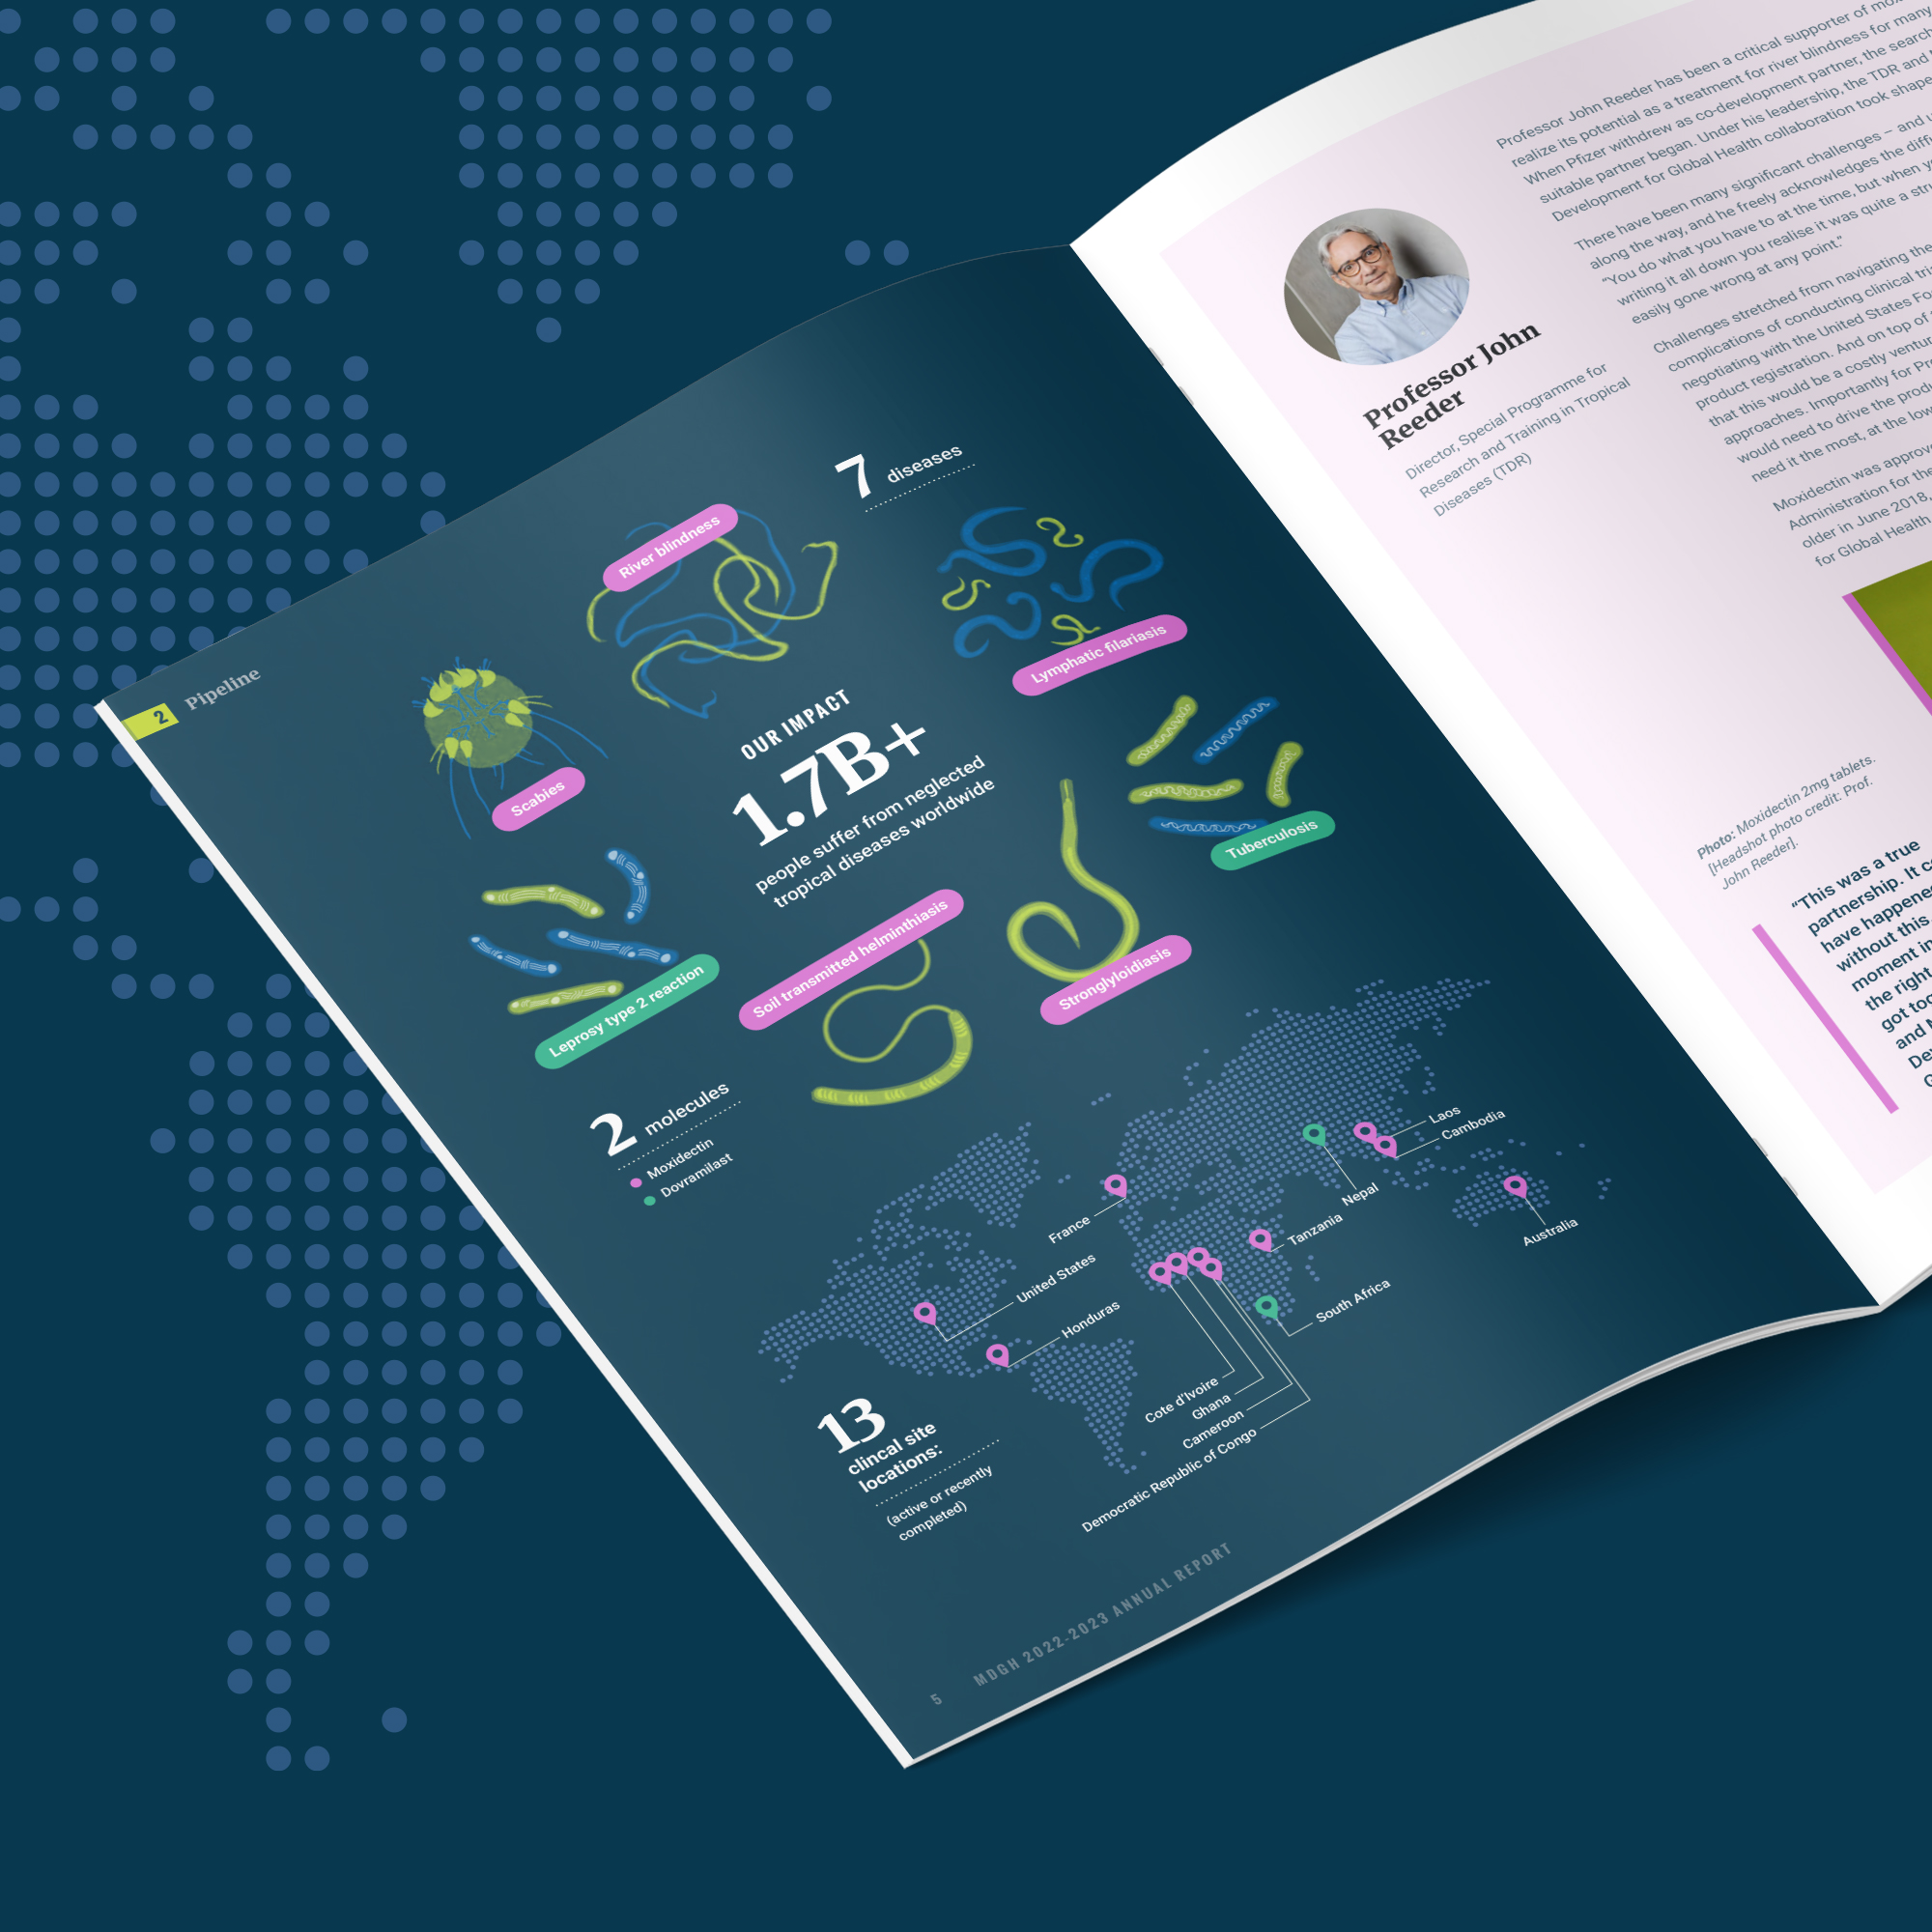
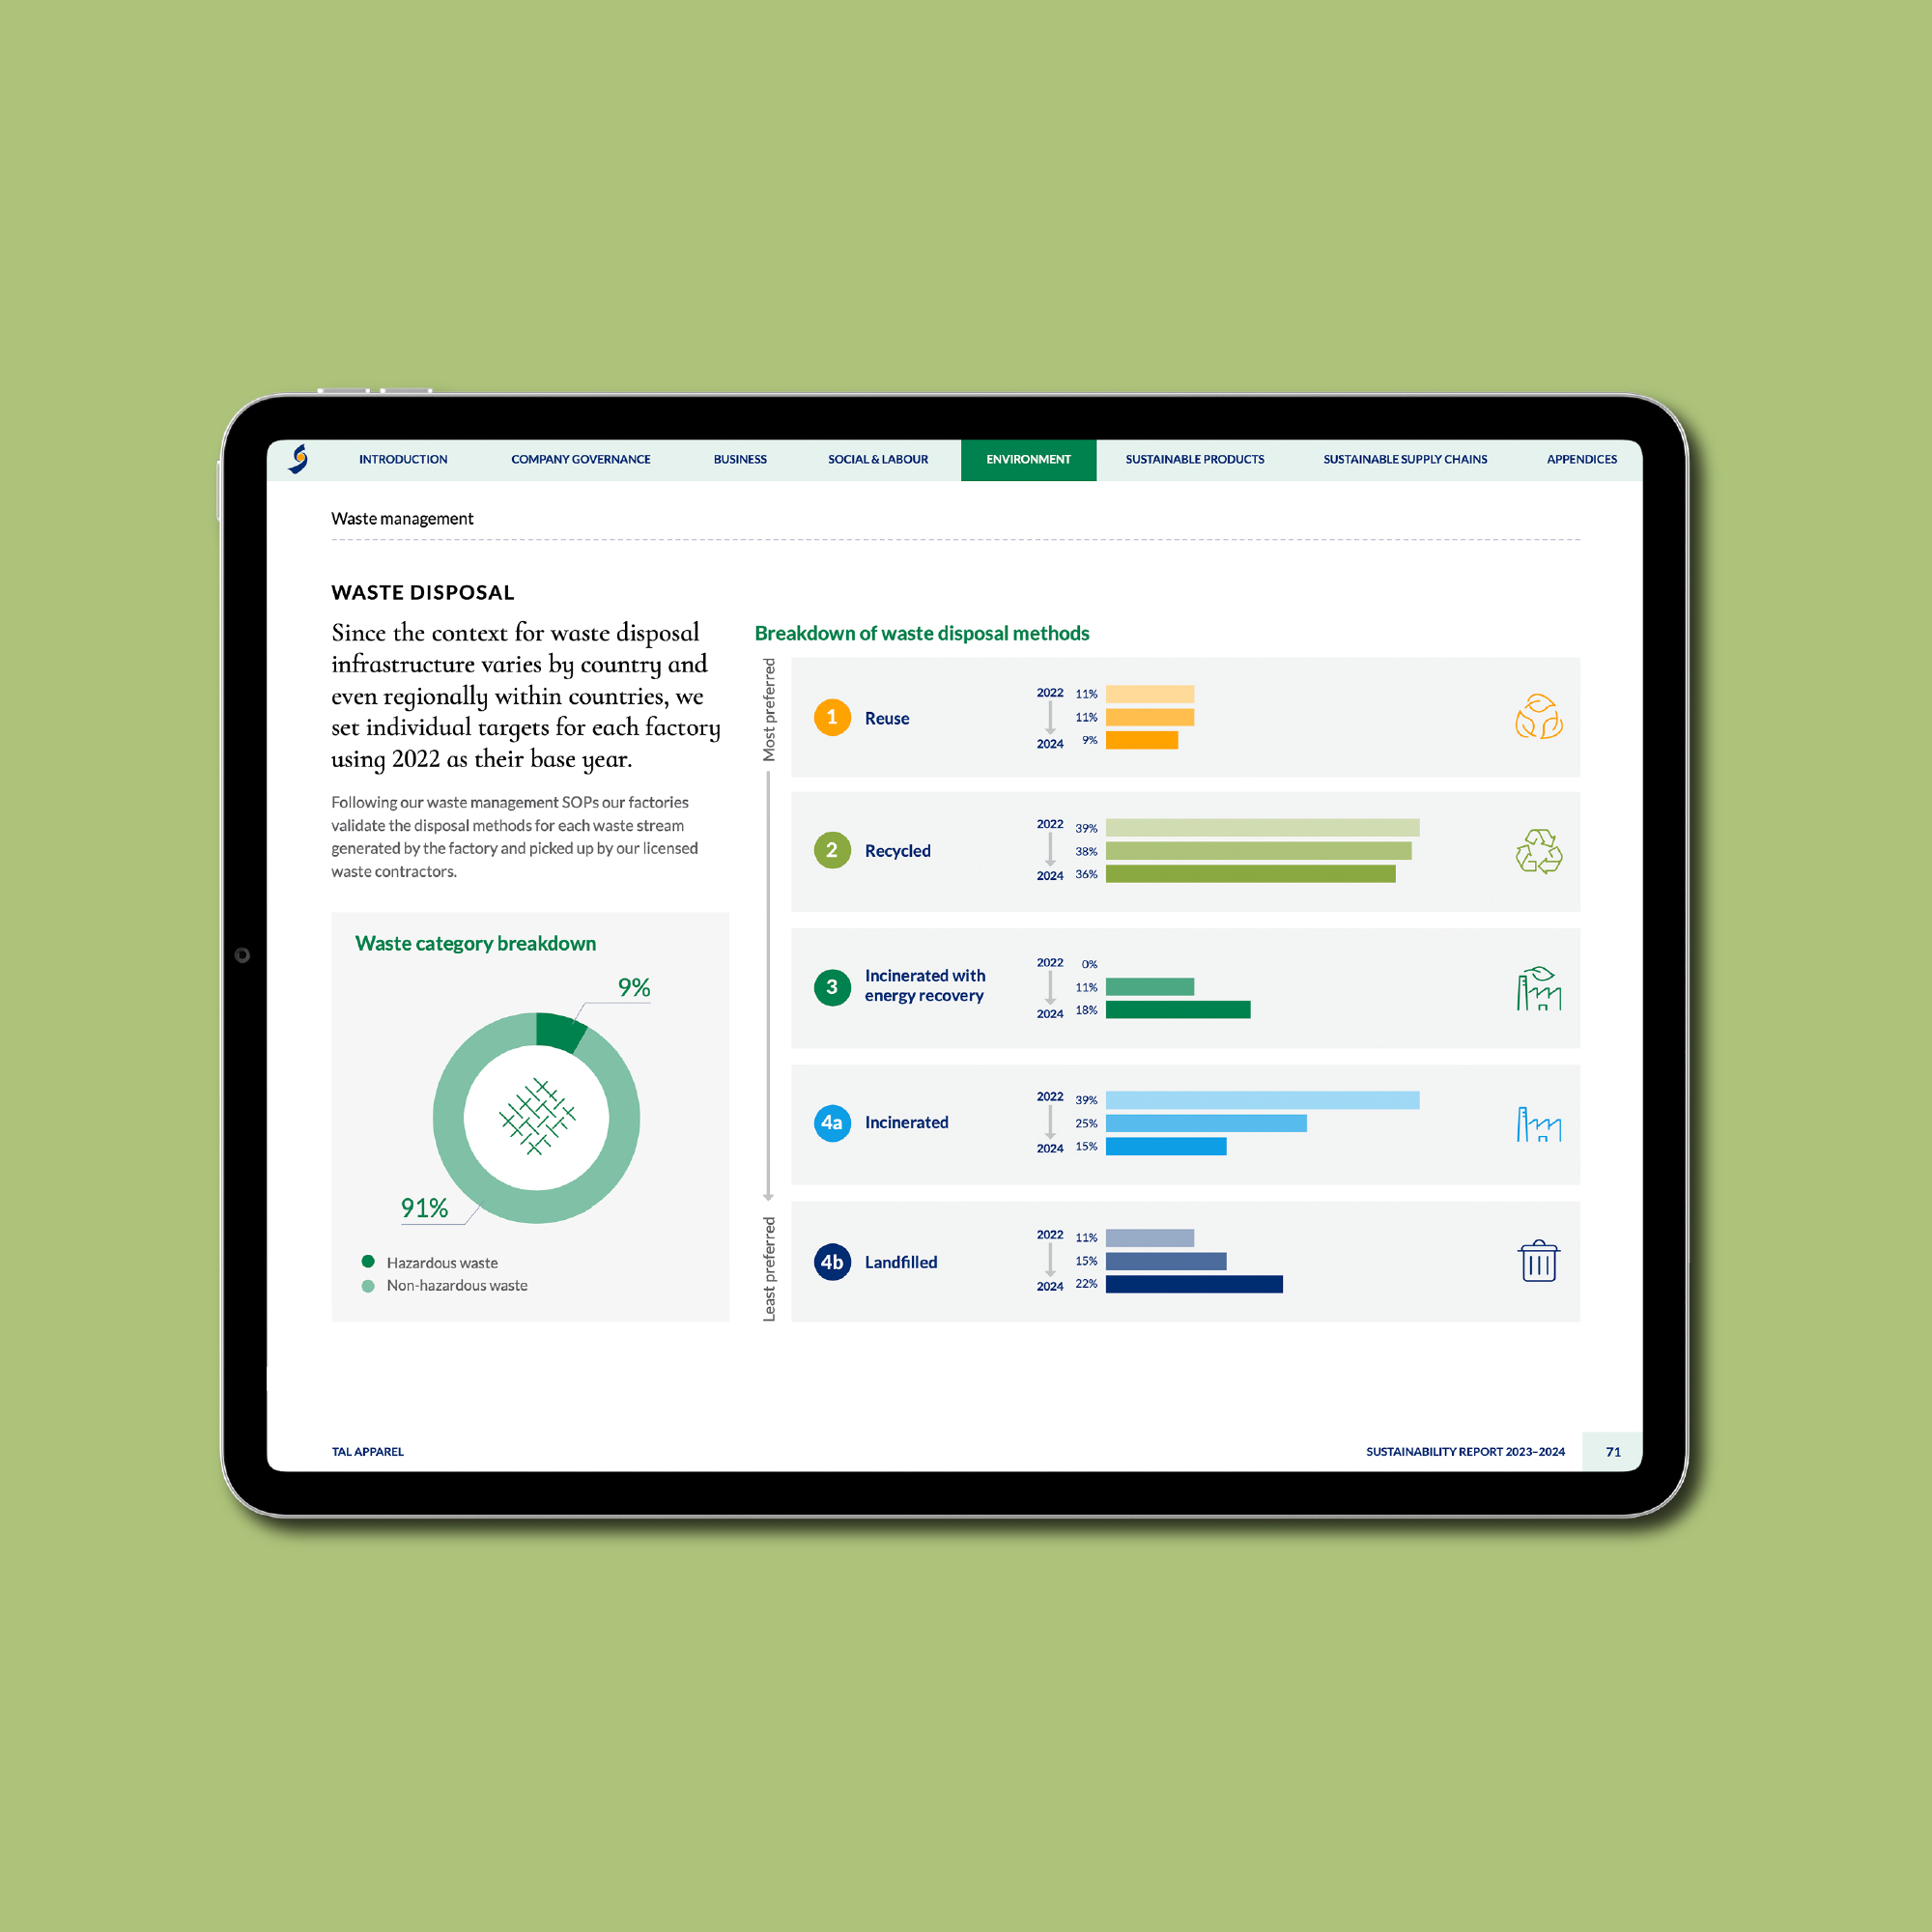
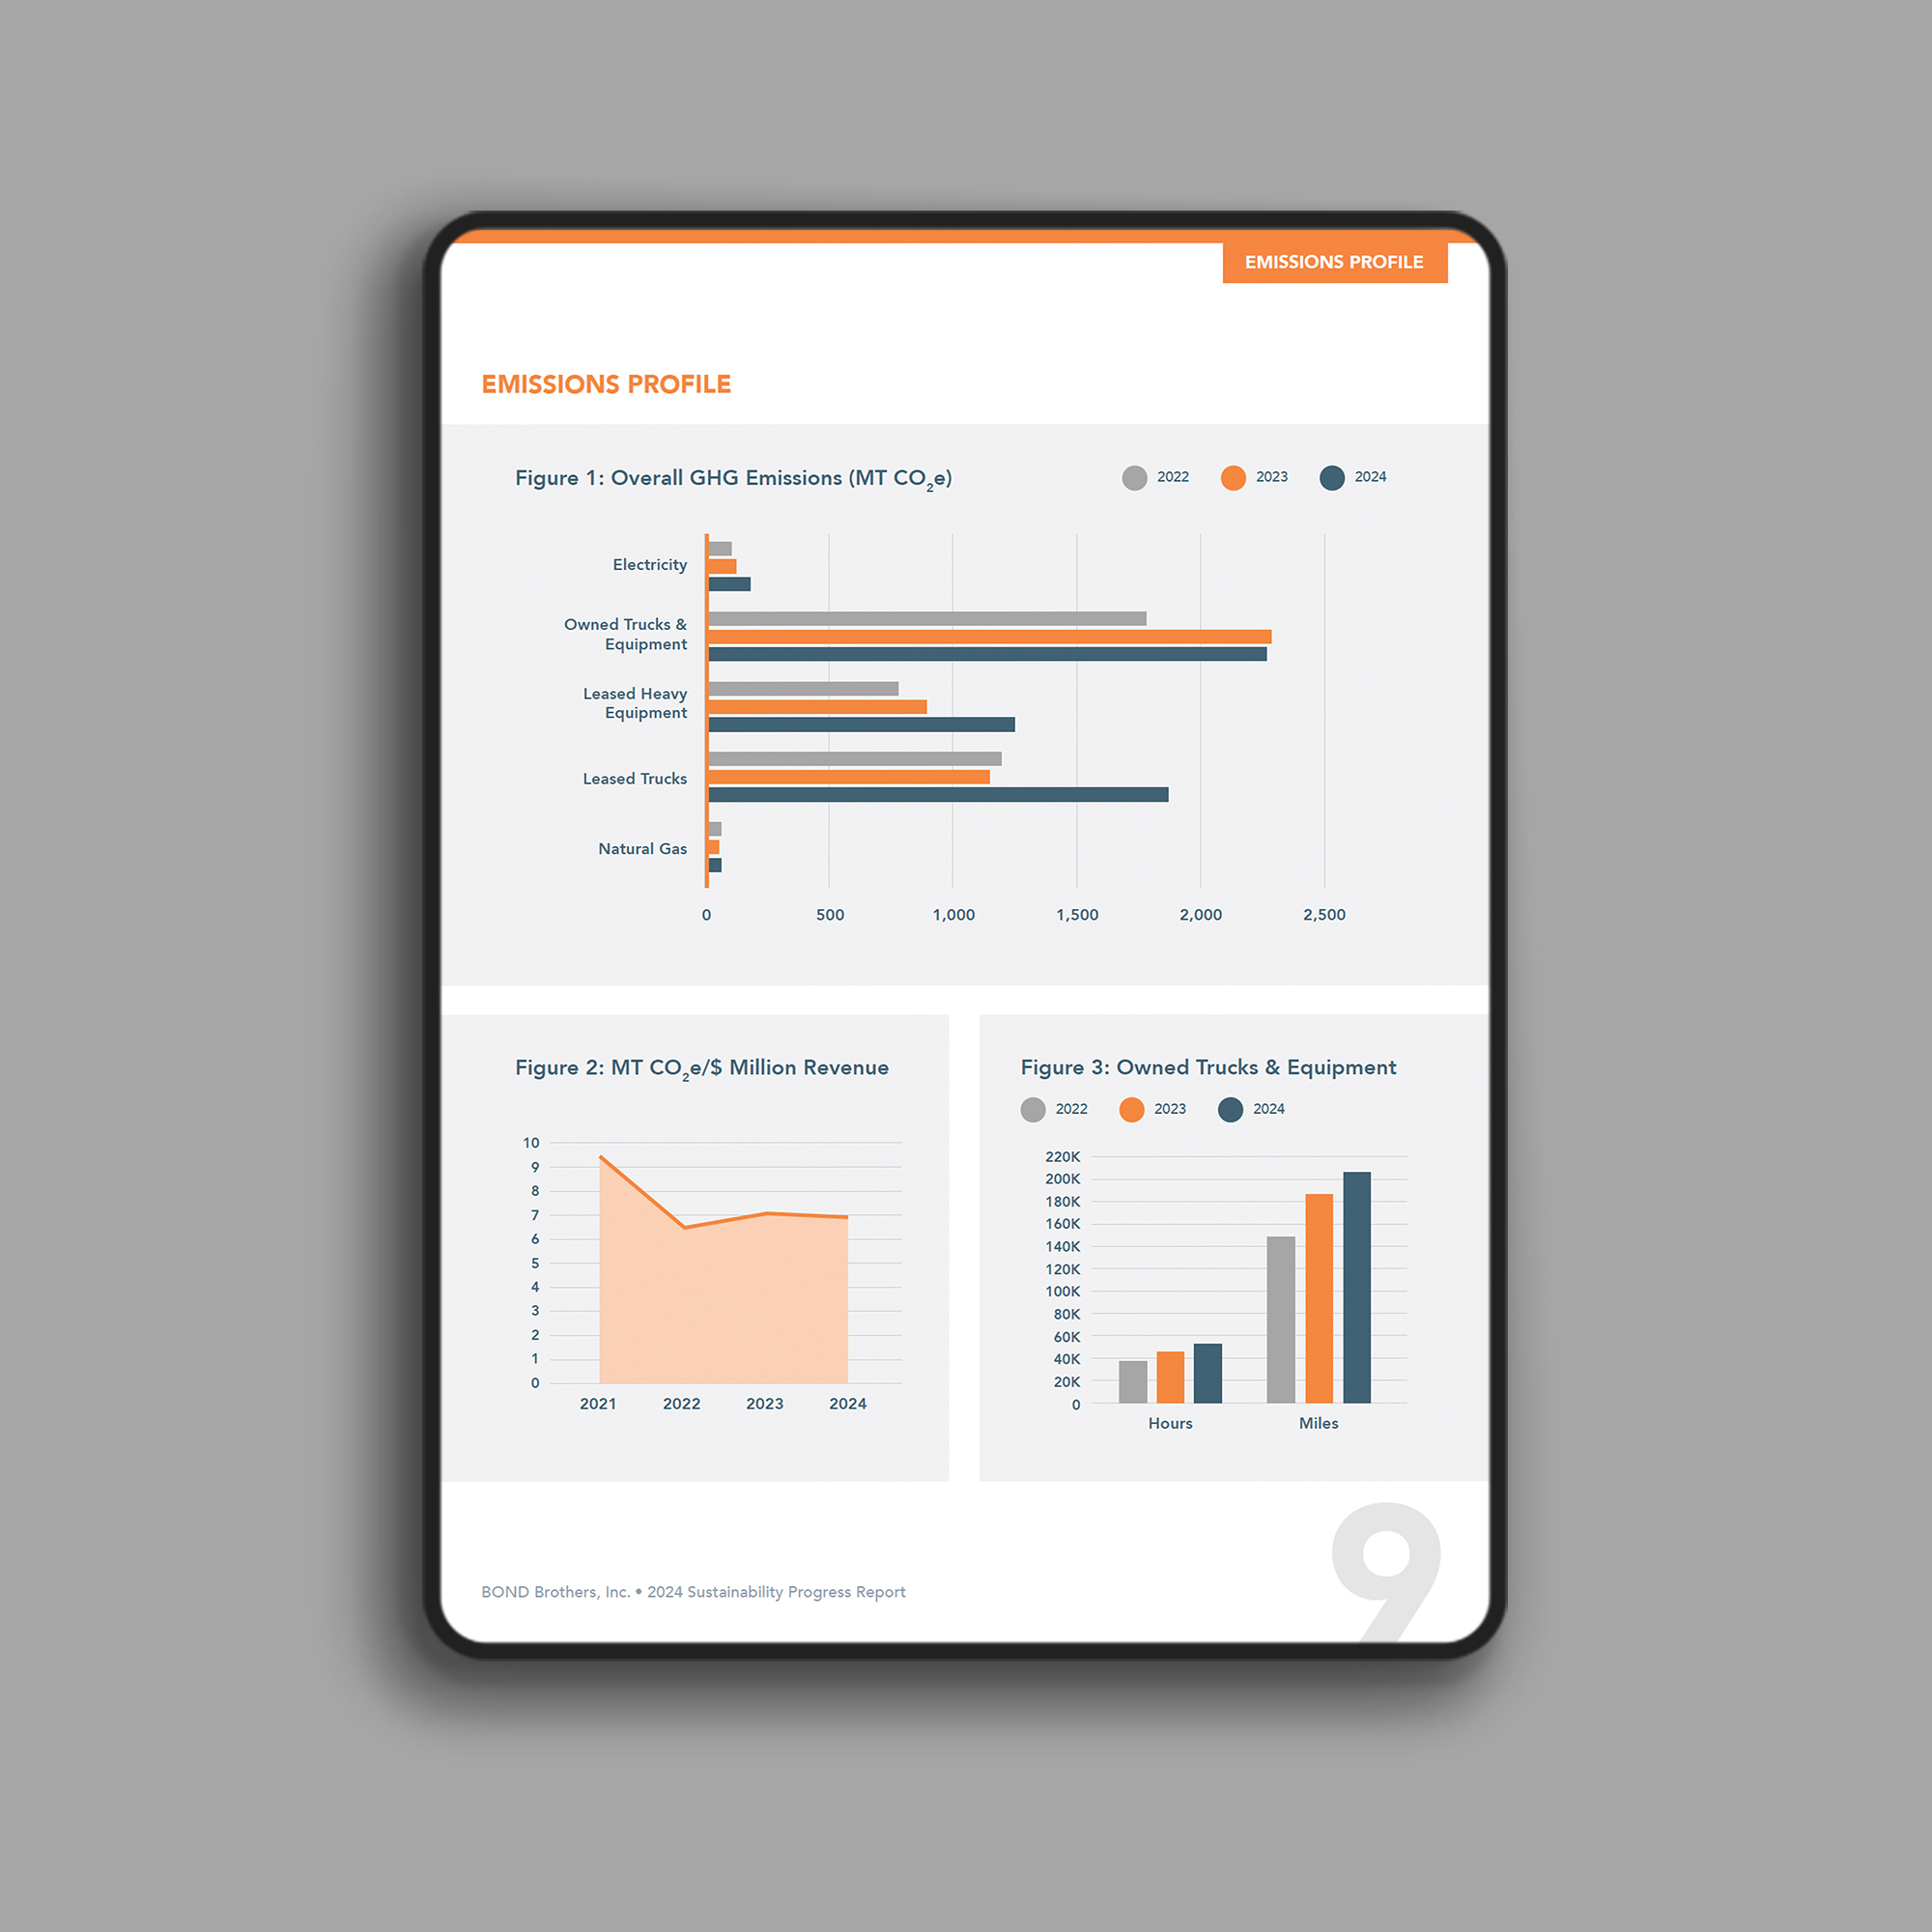
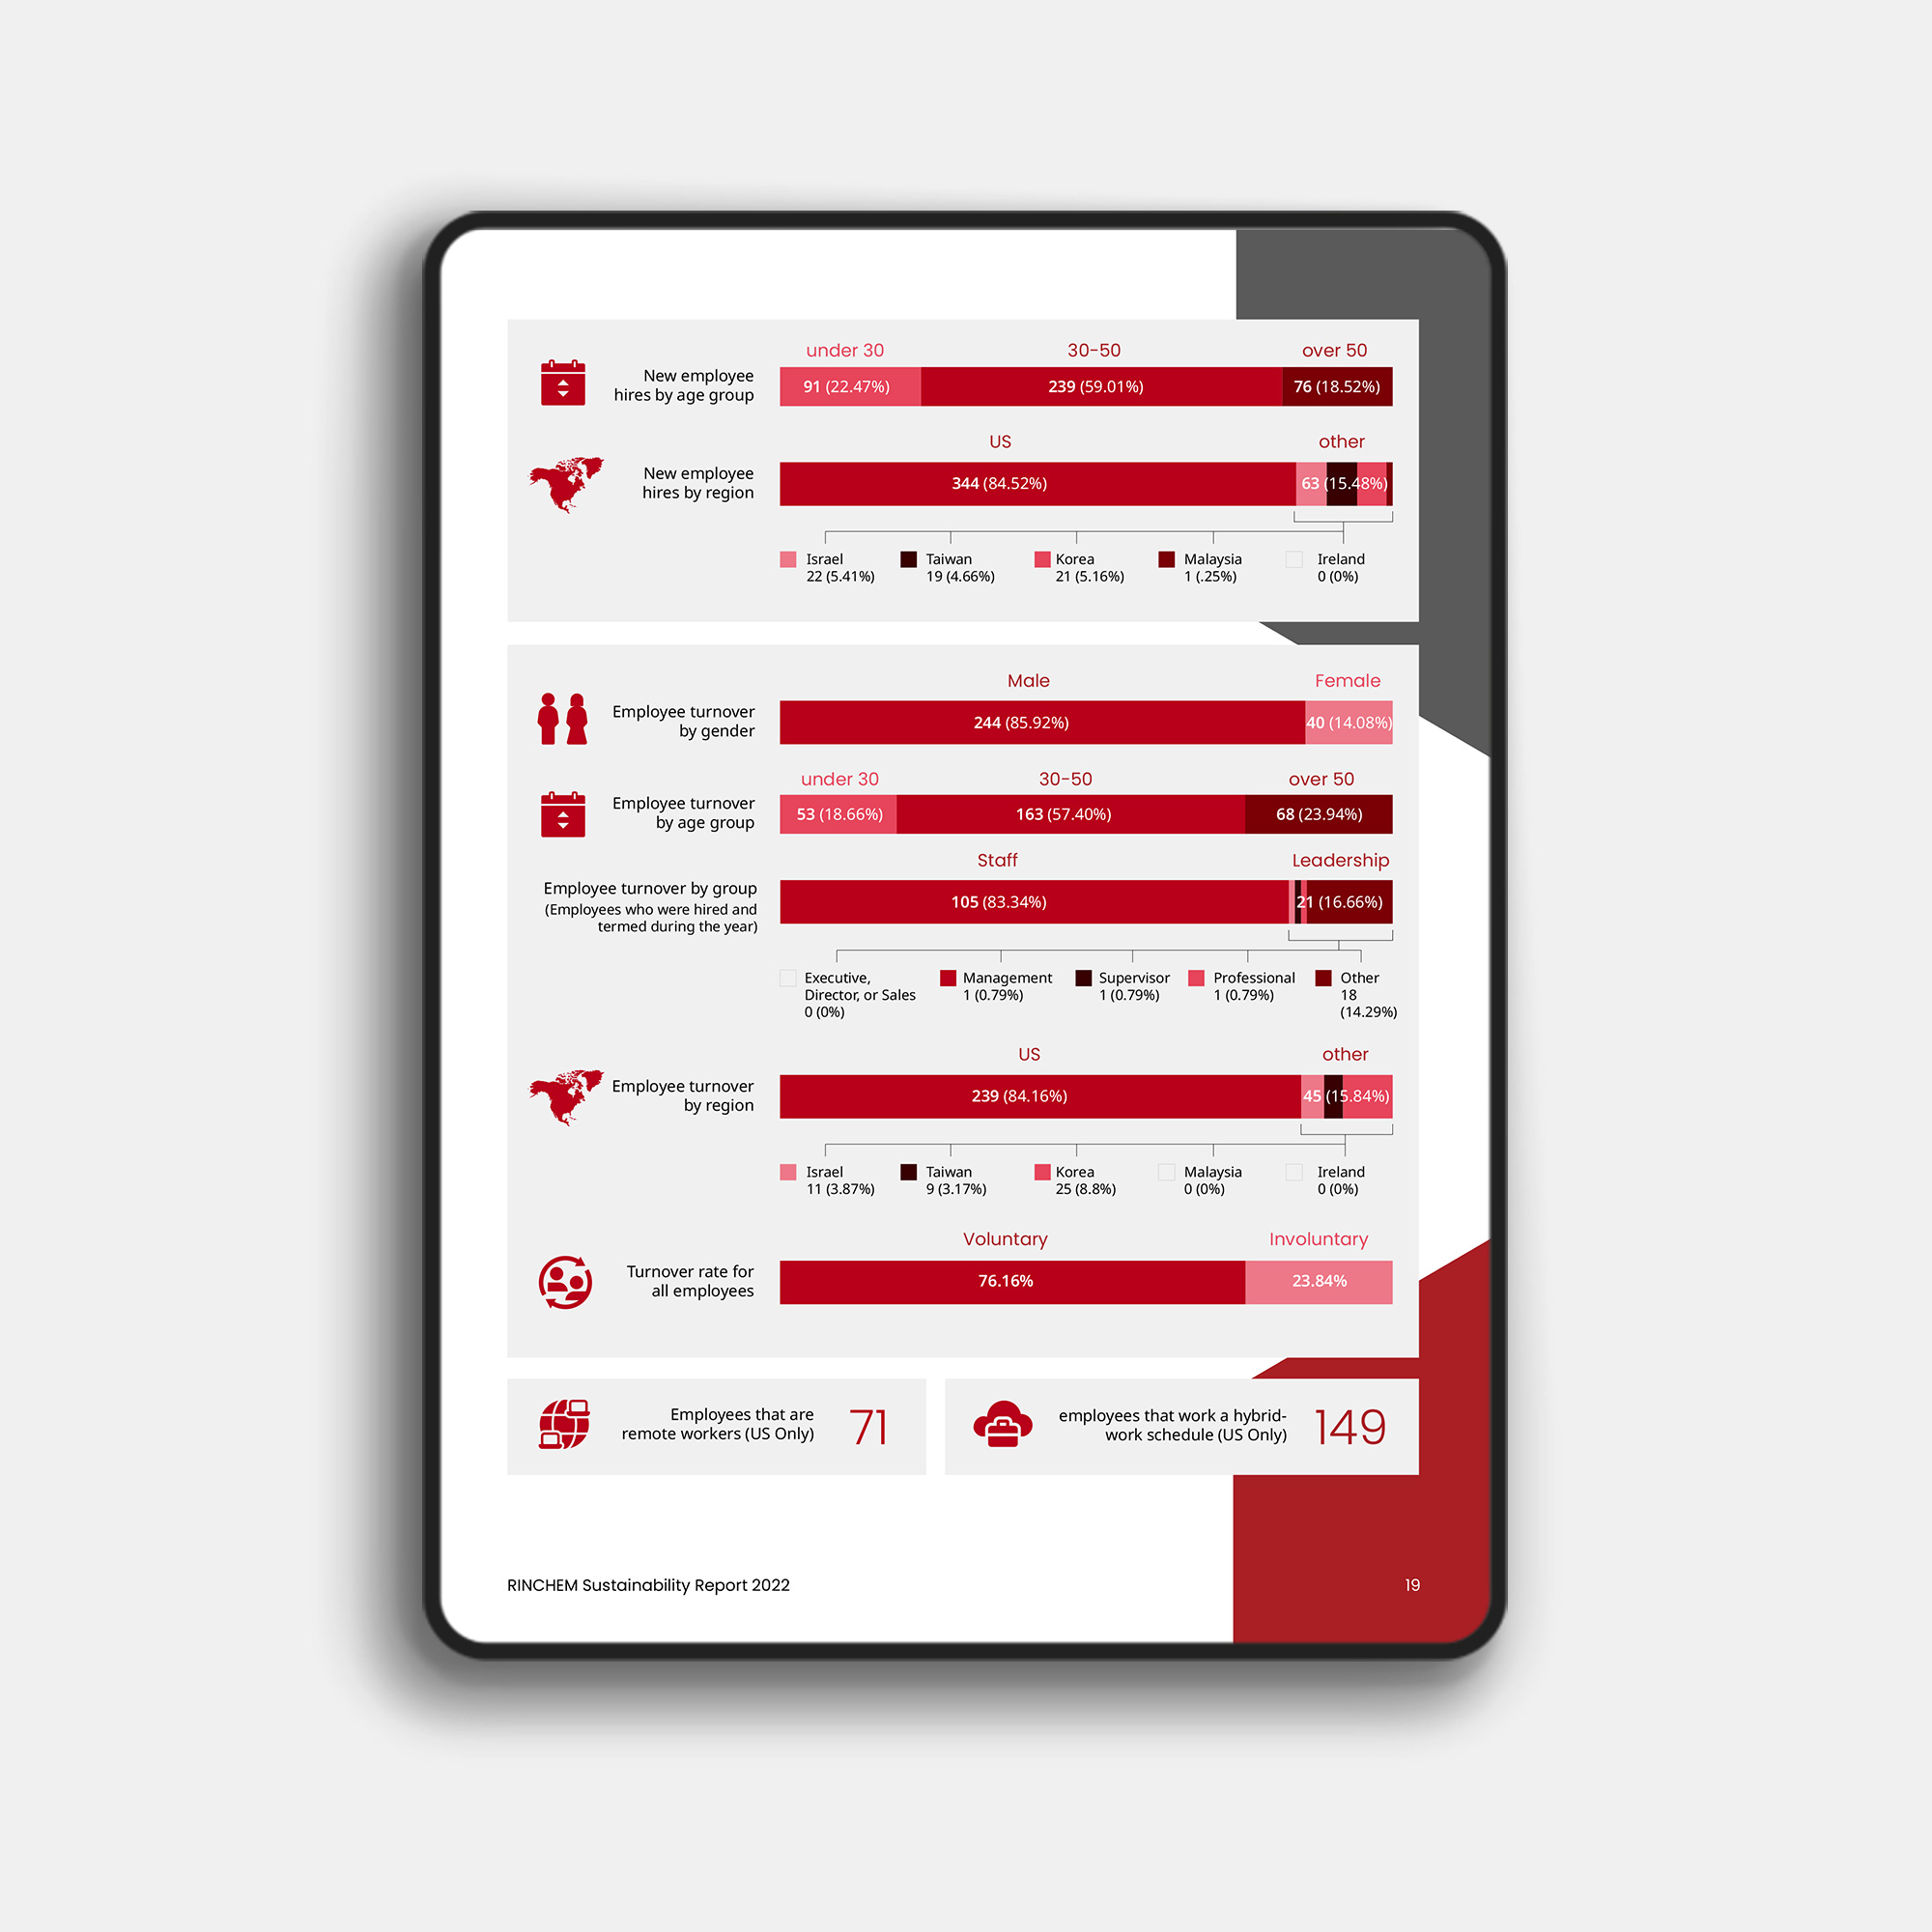
5. Clear data visualisation over decorative design
As reporting requirements grow, so does the volume of data. In response, annual report design in 2026 is prioritising clarity over decoration.
Design trends we’re seeing include:
- Simplified charts and graphs with clear labelling
- Consistent icon systems to support navigation and comprehension
- More white space to reduce cognitive load
- Fewer ‘design flourishes’, more purposeful visual structure
Good design helps readers understand the data, not just admire it.
6. Longevity and adaptability in report design
With tighter timelines and increasing compliance demands, organisations are looking for annual report designs that last longer than a single reporting cycle.
This means:
- Flexible templates that can be reused and updated
- Modular layouts that accommodate changing content lengths
- Design systems that work across annual reports, sustainability reports and corporate plans
A well‑designed annual report in 2026 isn’t just about this year – it’s about setting a foundation for future reporting.
Looking ahead
Annual report design is becoming more strategic, more accessible and more interconnected with sustainability reporting. Whether delivered as a polished PDF, an interactive web experience, or both, the most effective reports in 2026 will be those that prioritise clarity, usability and transparency.
If you’re planning your next annual report, now is the time to think beyond the document and consider how design can support compliance, storytelling and long-term impact.
Need help with your next annual report design?
We specialise in designing annual reports, sustainability reports and corporate plans that balance clarity, accessibility and visual impact.
Visit our annual report design service page or request a quote below – we’ll scope the right approach for your goals:
Request a quote