Turn complex data into clear, actionable insights with our expert dashboard designers.
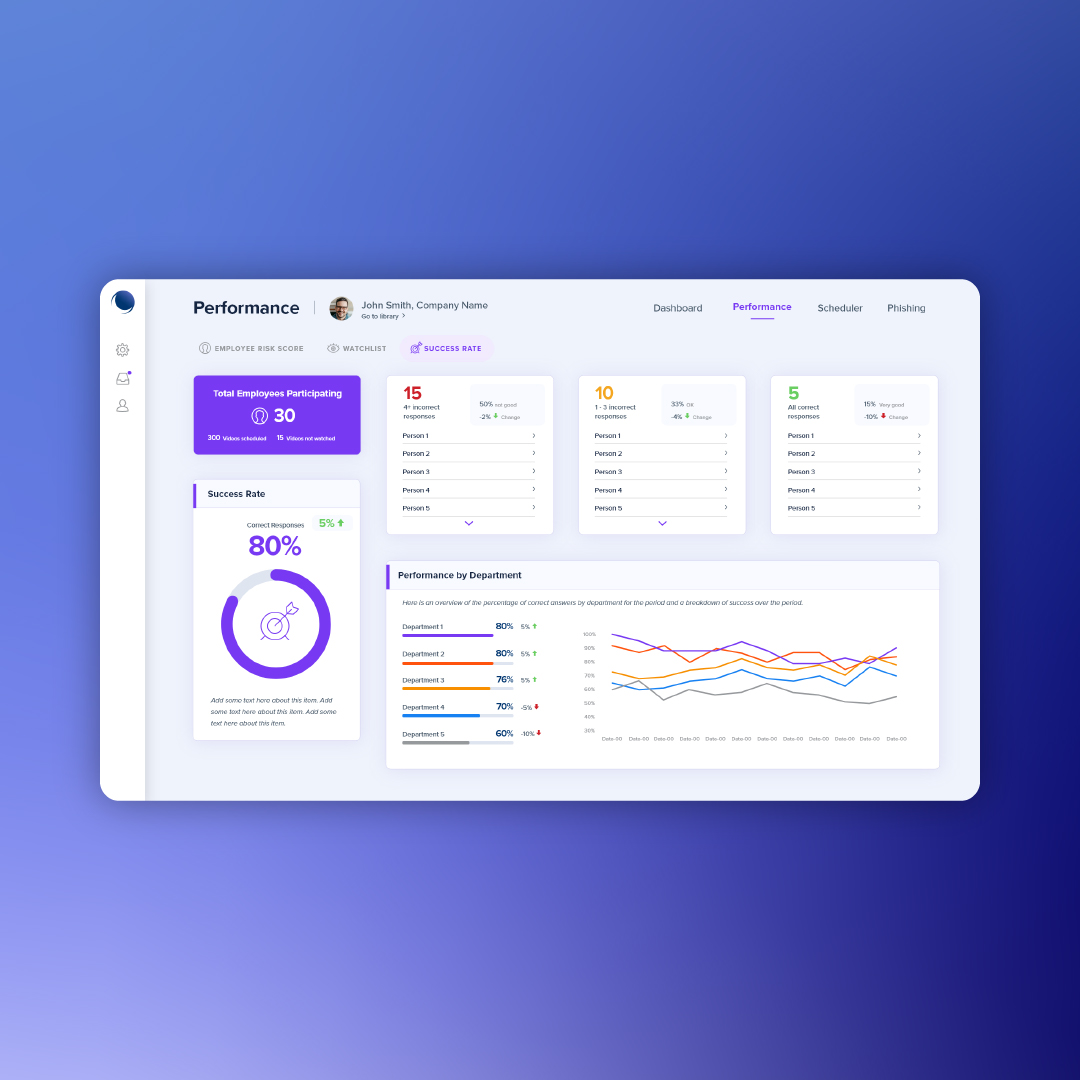
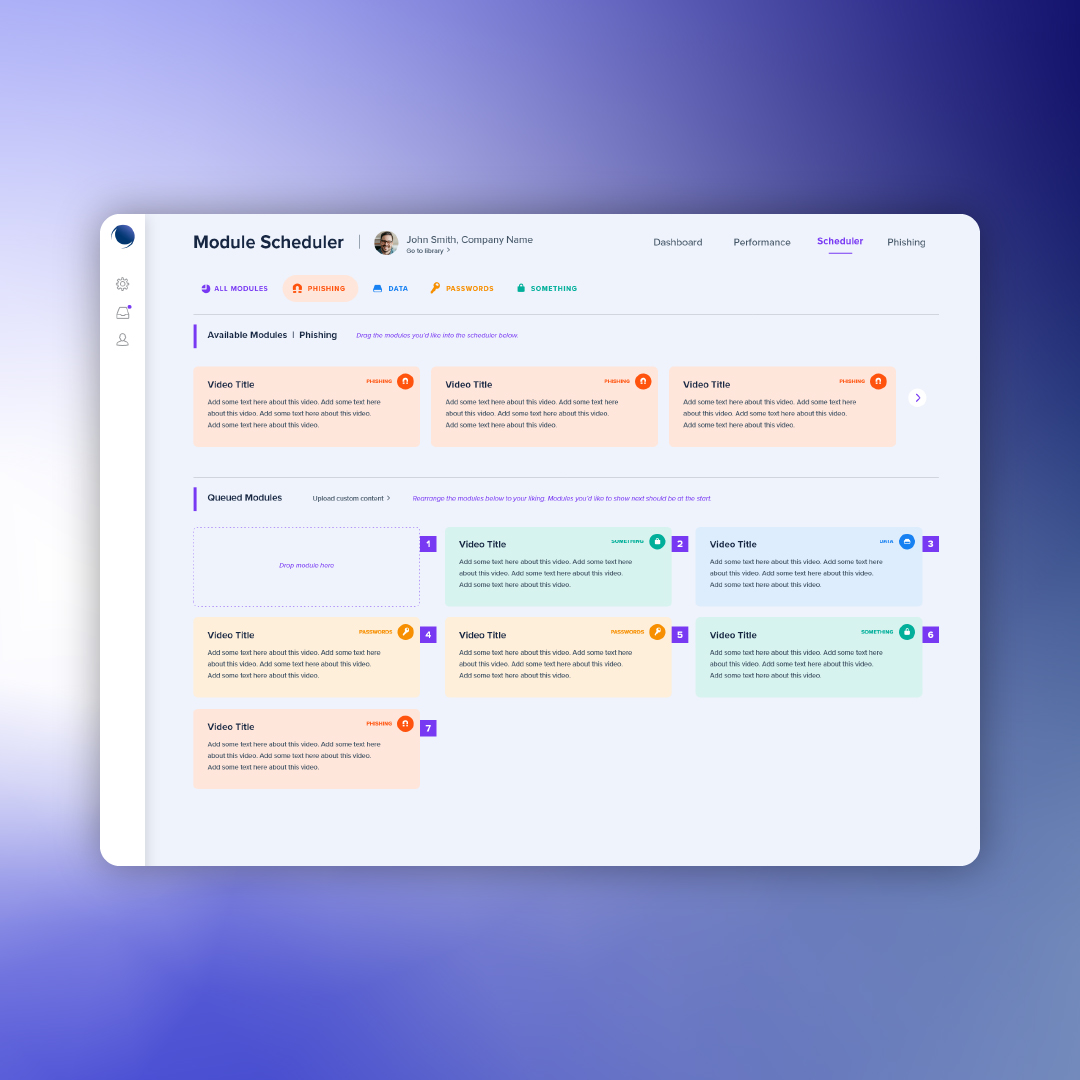
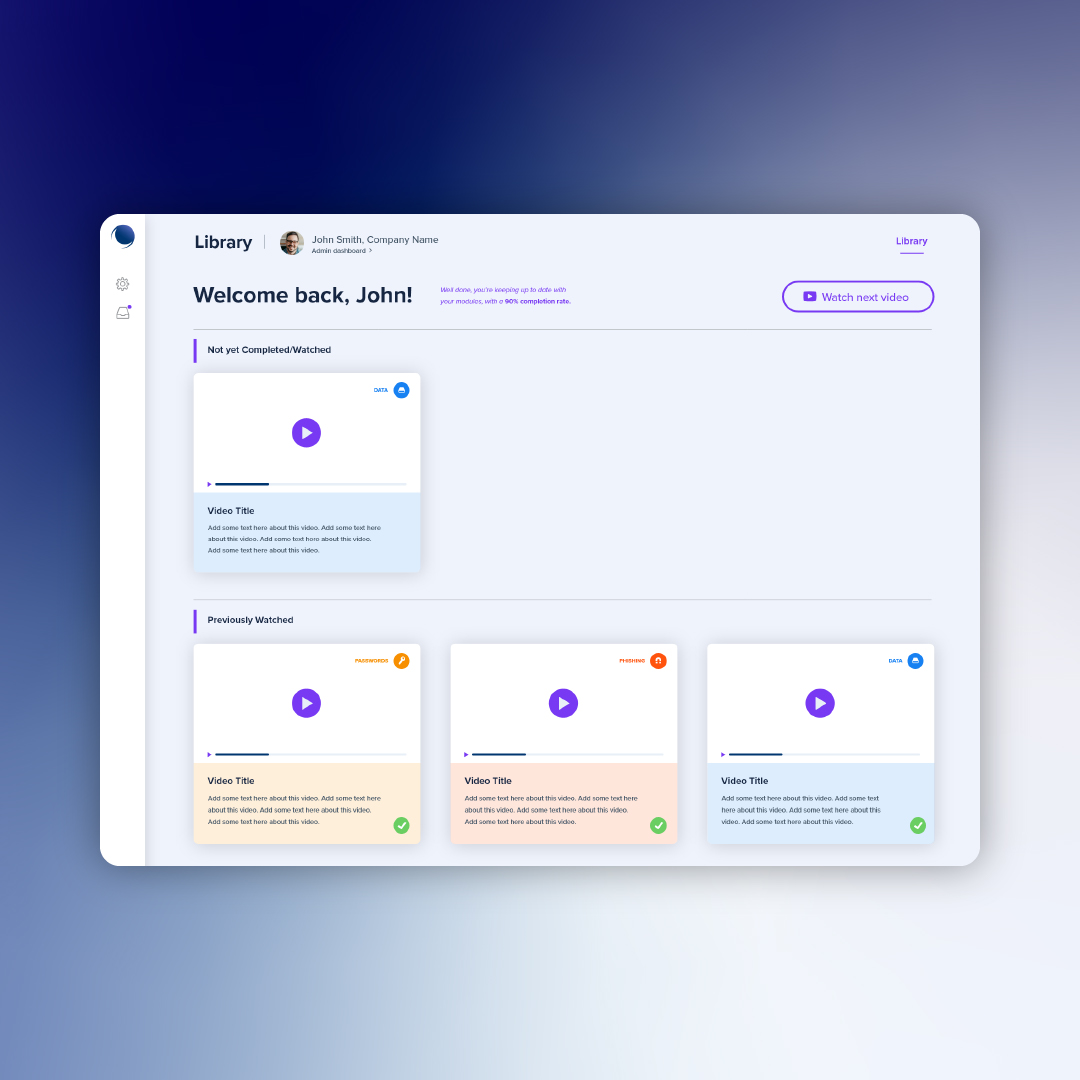
As a specialist data visualisation agency, we create custom business intelligence (BI) dashboards that combine clarity, usability, and strong visual identity.
Whether you’re using Power BI, Tableau, or IBM Cognos, our dashboard design services help your team and stakeholders instantly understand the story your data is telling.
We design dashboards that are not only functional but engaging – making it easier to track KPIs, spot trends, and make confident decisions.