Infographic design process

1

Requirements gathering and estimate

Contact us with your project details and we’ll discuss your objectives, audience, and the type of infographic you need (static, interactive, or illustration). A discovery call can be arranged to discuss requirements in more detail if preferred.

2

Quote sign-off and design discovery

We start by reviewing your brand style guidelines, data sets, and key messages. This ensures our creative direction aligns with your requirements and that we choose the right format, style, and level of detail for your infographic.

3

Concept design

We create and present initial design concepts (typically two, with variations as needed)–showing layout options, colour palettes, and illustrative styles–for your feedback and refinement. You can request additional concepts for an extra fee if desired.

4

Design development

Once a concept is approved, we create the full infographic, integrating your data, charts, icons, and other visual elements. For interactive or presentation-based infographics, we also develop clickable elements or slide layouts.

5

Review and revisions

Our standard package includes two rounds of design feedback plus a final proof to ensure your infographic is accurate, visually engaging, and ready to publish.

6

Final delivery and publication

We supply final files in your required formats–such as high-res PNG, JPG, PDF, or editable files in PowerPoint or Illustrator–ready for print, digital, or presentation use. 

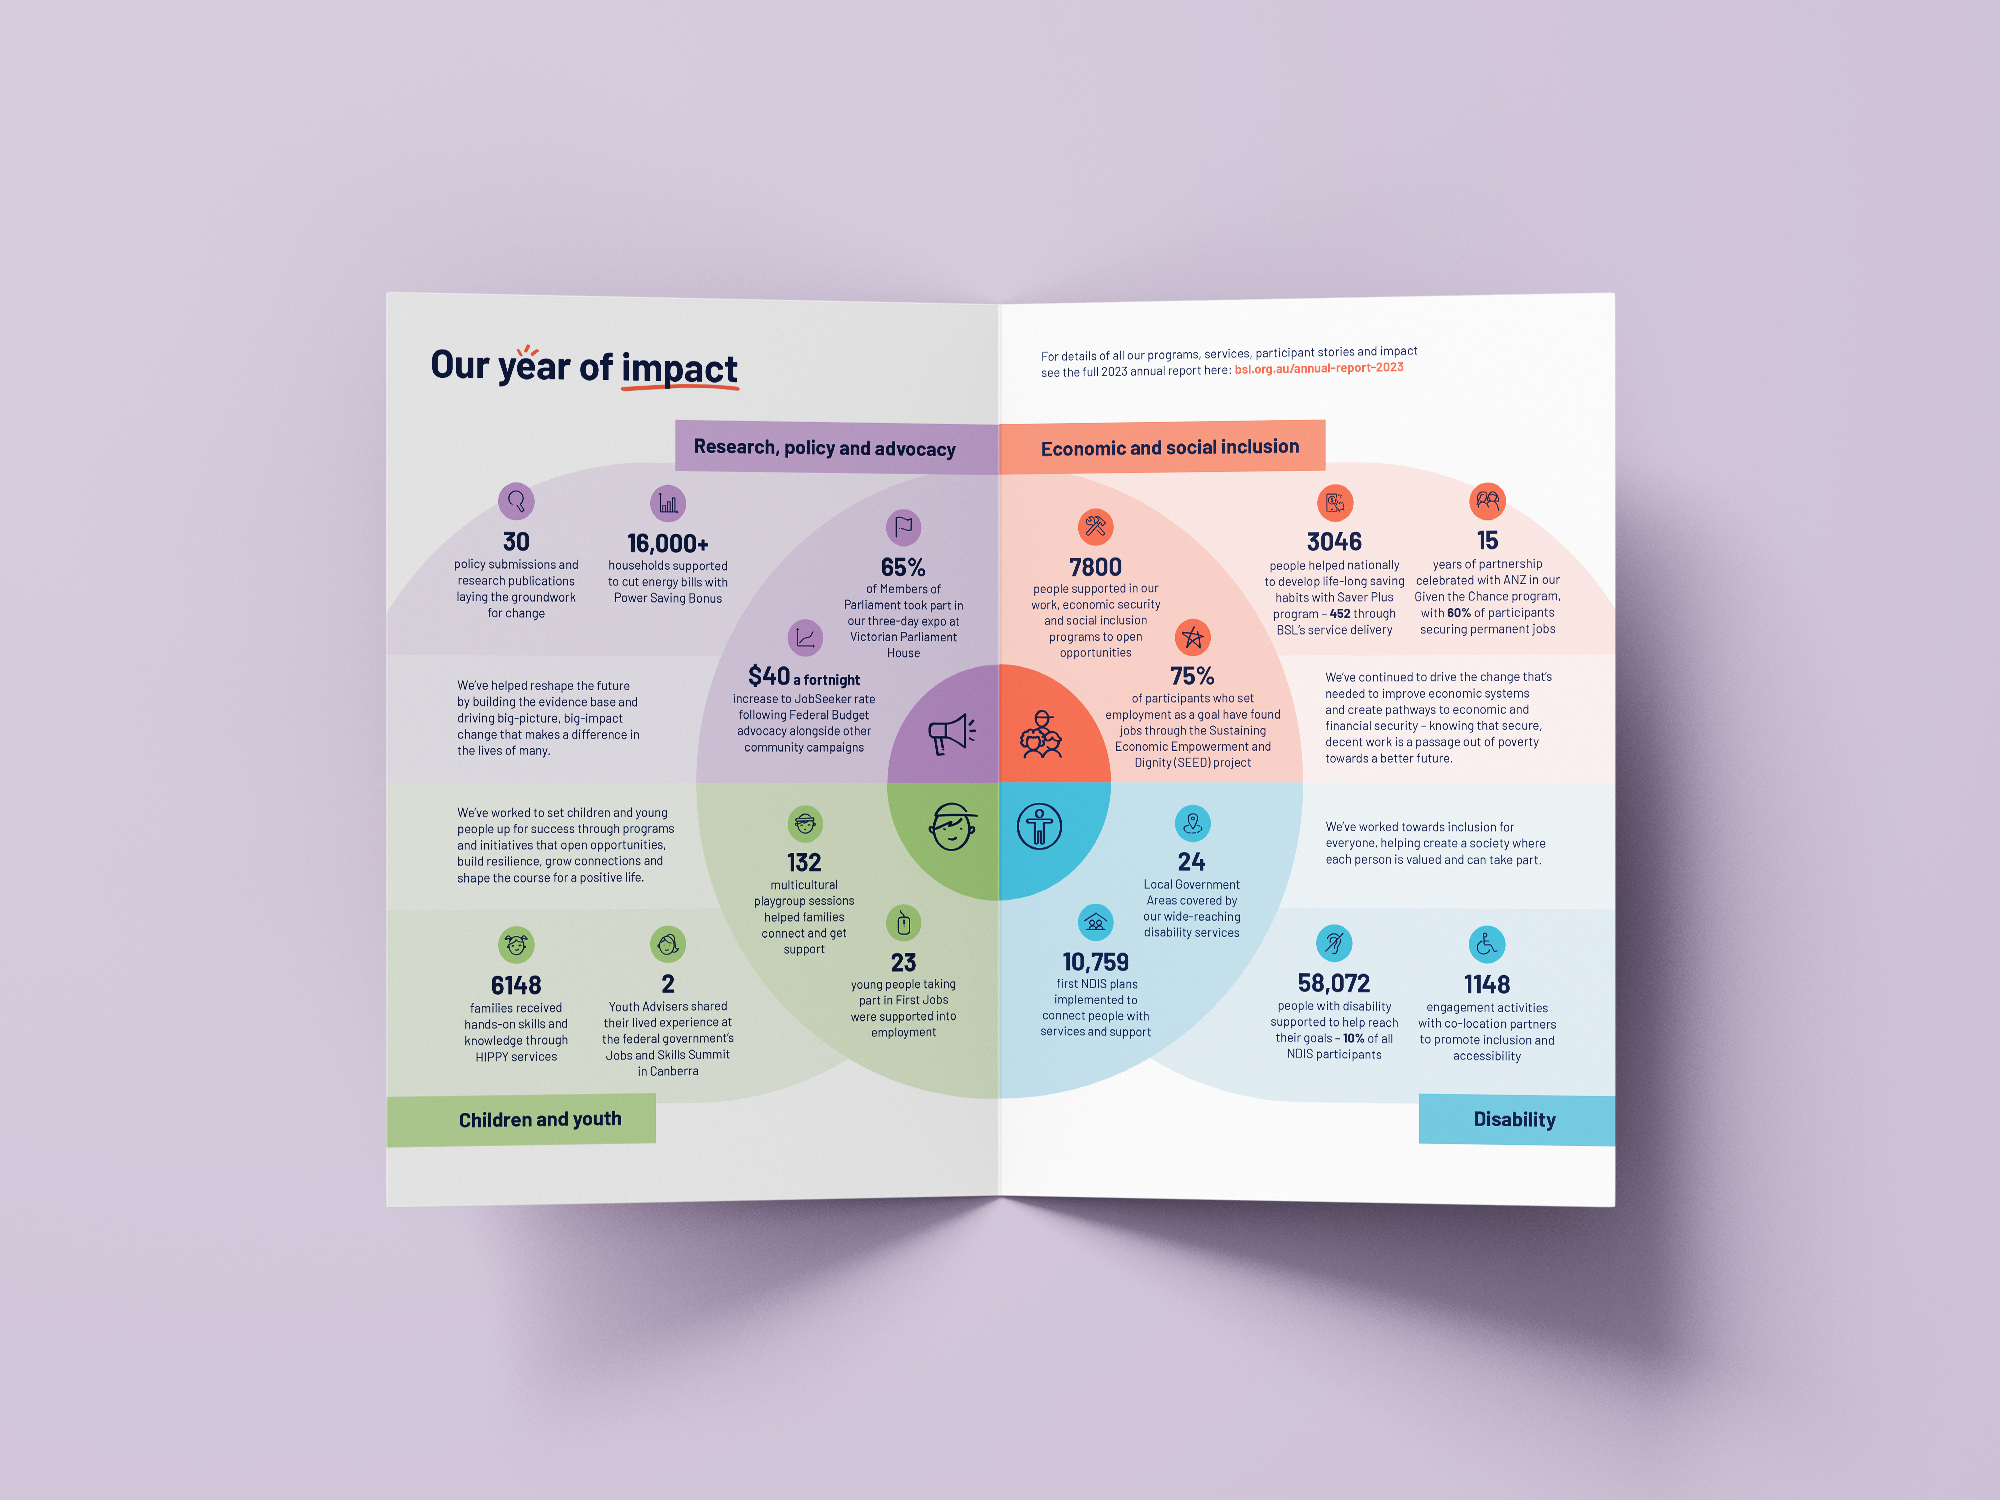
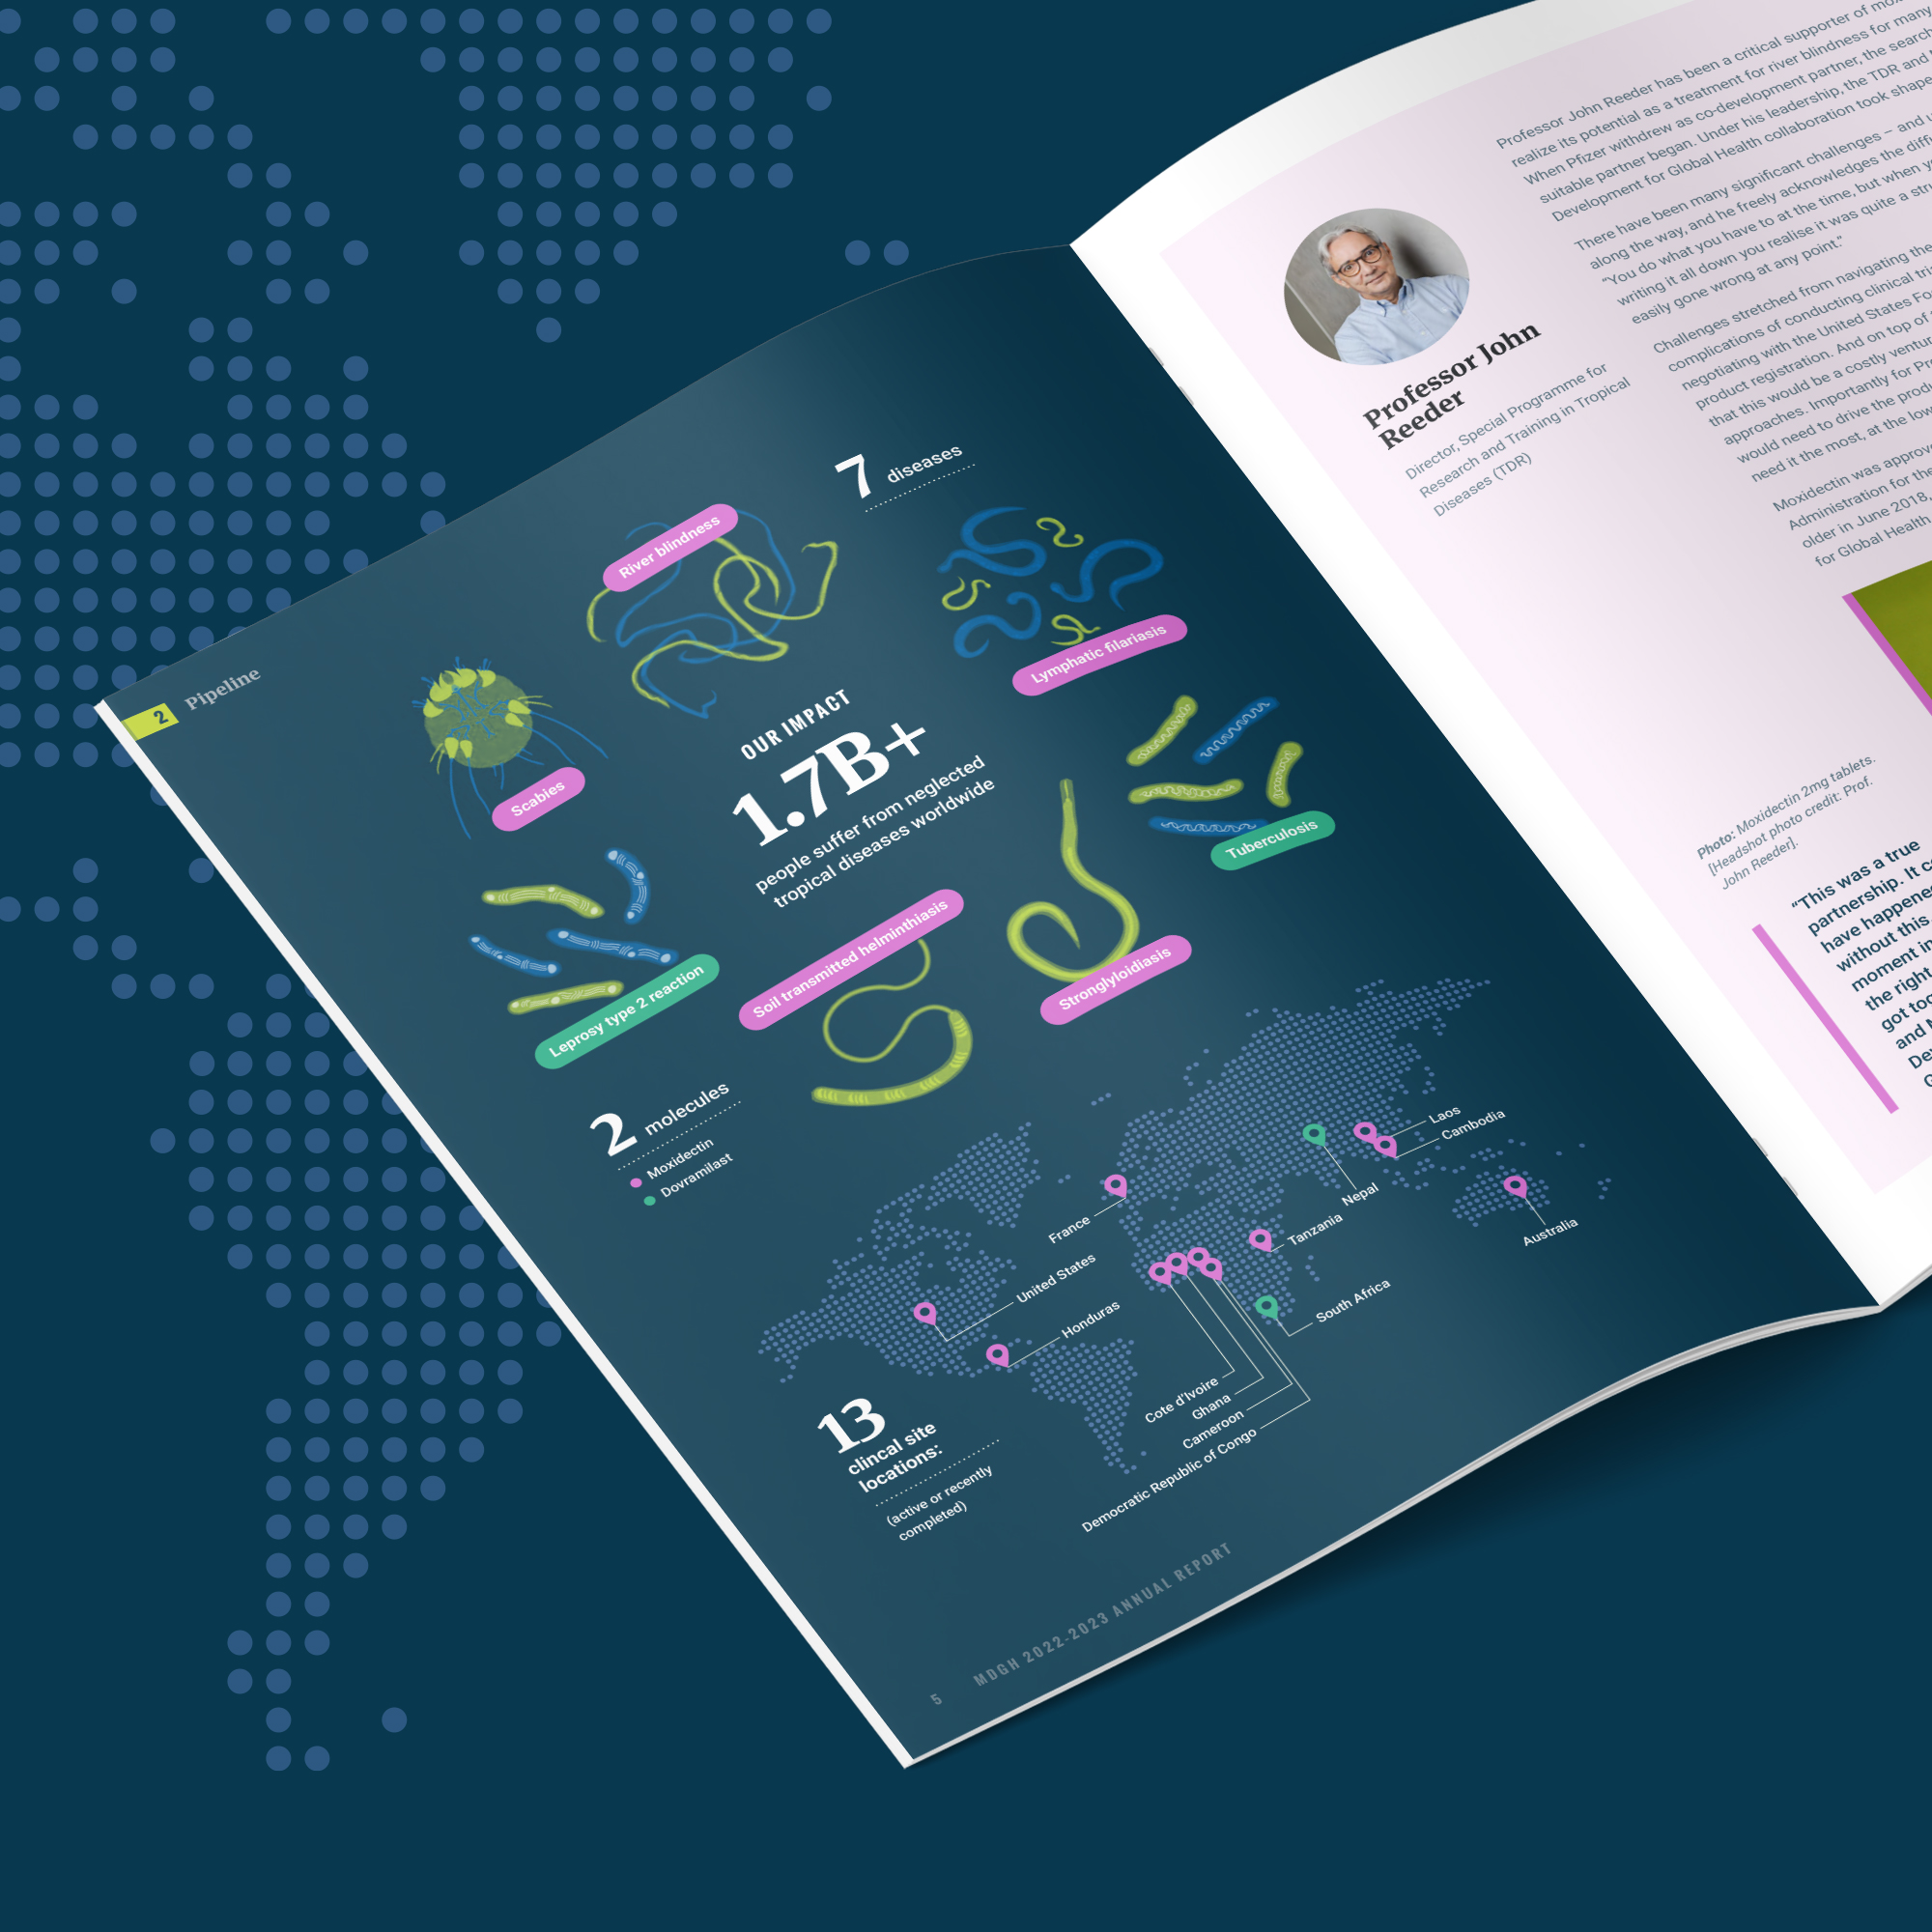
Inside spread of the Brotherhood of St. Laurence summary brochure from the 2023 Annual Report, featuring a full-colour infographic titled 'Our Impact'.

Infographic design helps you present valuable data and metrics in a concise and impactful way.

Infographics visually represent information so it’s easier to digest, and the process of creating them is often called data visualisation. Provide us with your raw data, sketches, or rudimentary graphs, and we transform them into infographics that can be packaged and presented in whichever format you need – print, digital, or interactive.

By combining stunning design with strong visual storytelling, we help your audience explore and engage with your content effectively.

See our work

Infographic design agency solutions

Greenish cyan line icon representing data flow and process mapping for static infographic design services.
Static infographic design

Eye-catching, easy-to-read infographics tailored to your brand and message. Perfect for reports, presentations, websites, and social media, these designs turn your data into clear, compelling visuals.

Greenish cyan line icon showing a bar and line graph with a cogwheel, representing data visualisation services.
Data visualisation

Transform raw numbers into meaningful insights through dynamic charts, graphs, and diagrams – making complex information clear, engaging, and easy to interpret.

Greenish cyan line icon of a pencil, representing custom illustration design services.
Custom illustrations

Enhance your visual language with unique illustrations that visually convey key concepts, add personality, and align seamlessly with your brand identity.

Greenish cyan line icon showing connected shapes including a square, circle, rectangle, and hexagon, representing a suite of infographics.
Suite of infographics

A branded set of infographics designed for ongoing campaigns, regular reporting, or multi-part storytelling – keeping your visuals consistent and recognisable.

Teal line icon of a hand pressing a button, symbolising interactivity and user engagement, including social media
Interactive infographic

Engage your audience with clickable infographics created in PowerPoint or web-based formats, allowing users to explore your content in more detail. Ideal for complex data sets, flow diagrams, and brand storytelling.

Line icon of a human head profile with a cube inside, representing a custom icon set for concepts and ideas.
Custom icon set

A suite of icons tailored to your brand style, helping to visually convey concepts, categories, and key messages across infographics, reports, presentations, and digital platforms.

As a specialist solutions consulting group that provides information and analytic services to our corporate clients, we engaged with EDCo. to help add an additional level of professional design to our solutions.  From our very first engagement we quickly realised that we received more than just wonderful designs. Other qualities like professionalism, experience and fast turnaround have enriched our projects to a point where EDCo's involvement has become a constant feature in our projects that have a high graphic or visualisation component."

Sonja has worked closely with me in designing our circa 30-page pitch deck, investor summary slides, and other multi-page presentations needed to pitch key partners. Sonja is an incredible designer, but she's also a great instructor too. Most importantly, the team at EDCo. are a pleasure to work with - prompt and hardworking. Their performance has been consistently high and turnaround quick. We will continue to use EDCo.'s services for the foreseeable future.

FAQs

What’s the purpose of an infographic?

Infographics can help your company or organisation determine patterns, monitor data relationships and predict changes in variables over a projected period. They are typically used to synthesise and simplify the presentation of often complex data, making your statistical information more appealing to stakeholders and customers.

An effective infographic can communicate a message quickly when speed is key, while also adding value to your brand by supporting marketing efforts and helping you reach new customers. They can also make reports, presentations and campaigns more engaging, ensuring your message resonates with your audience.

What does an infographic project involve?

Depending on your requirements, an infographic might be created in the form of:

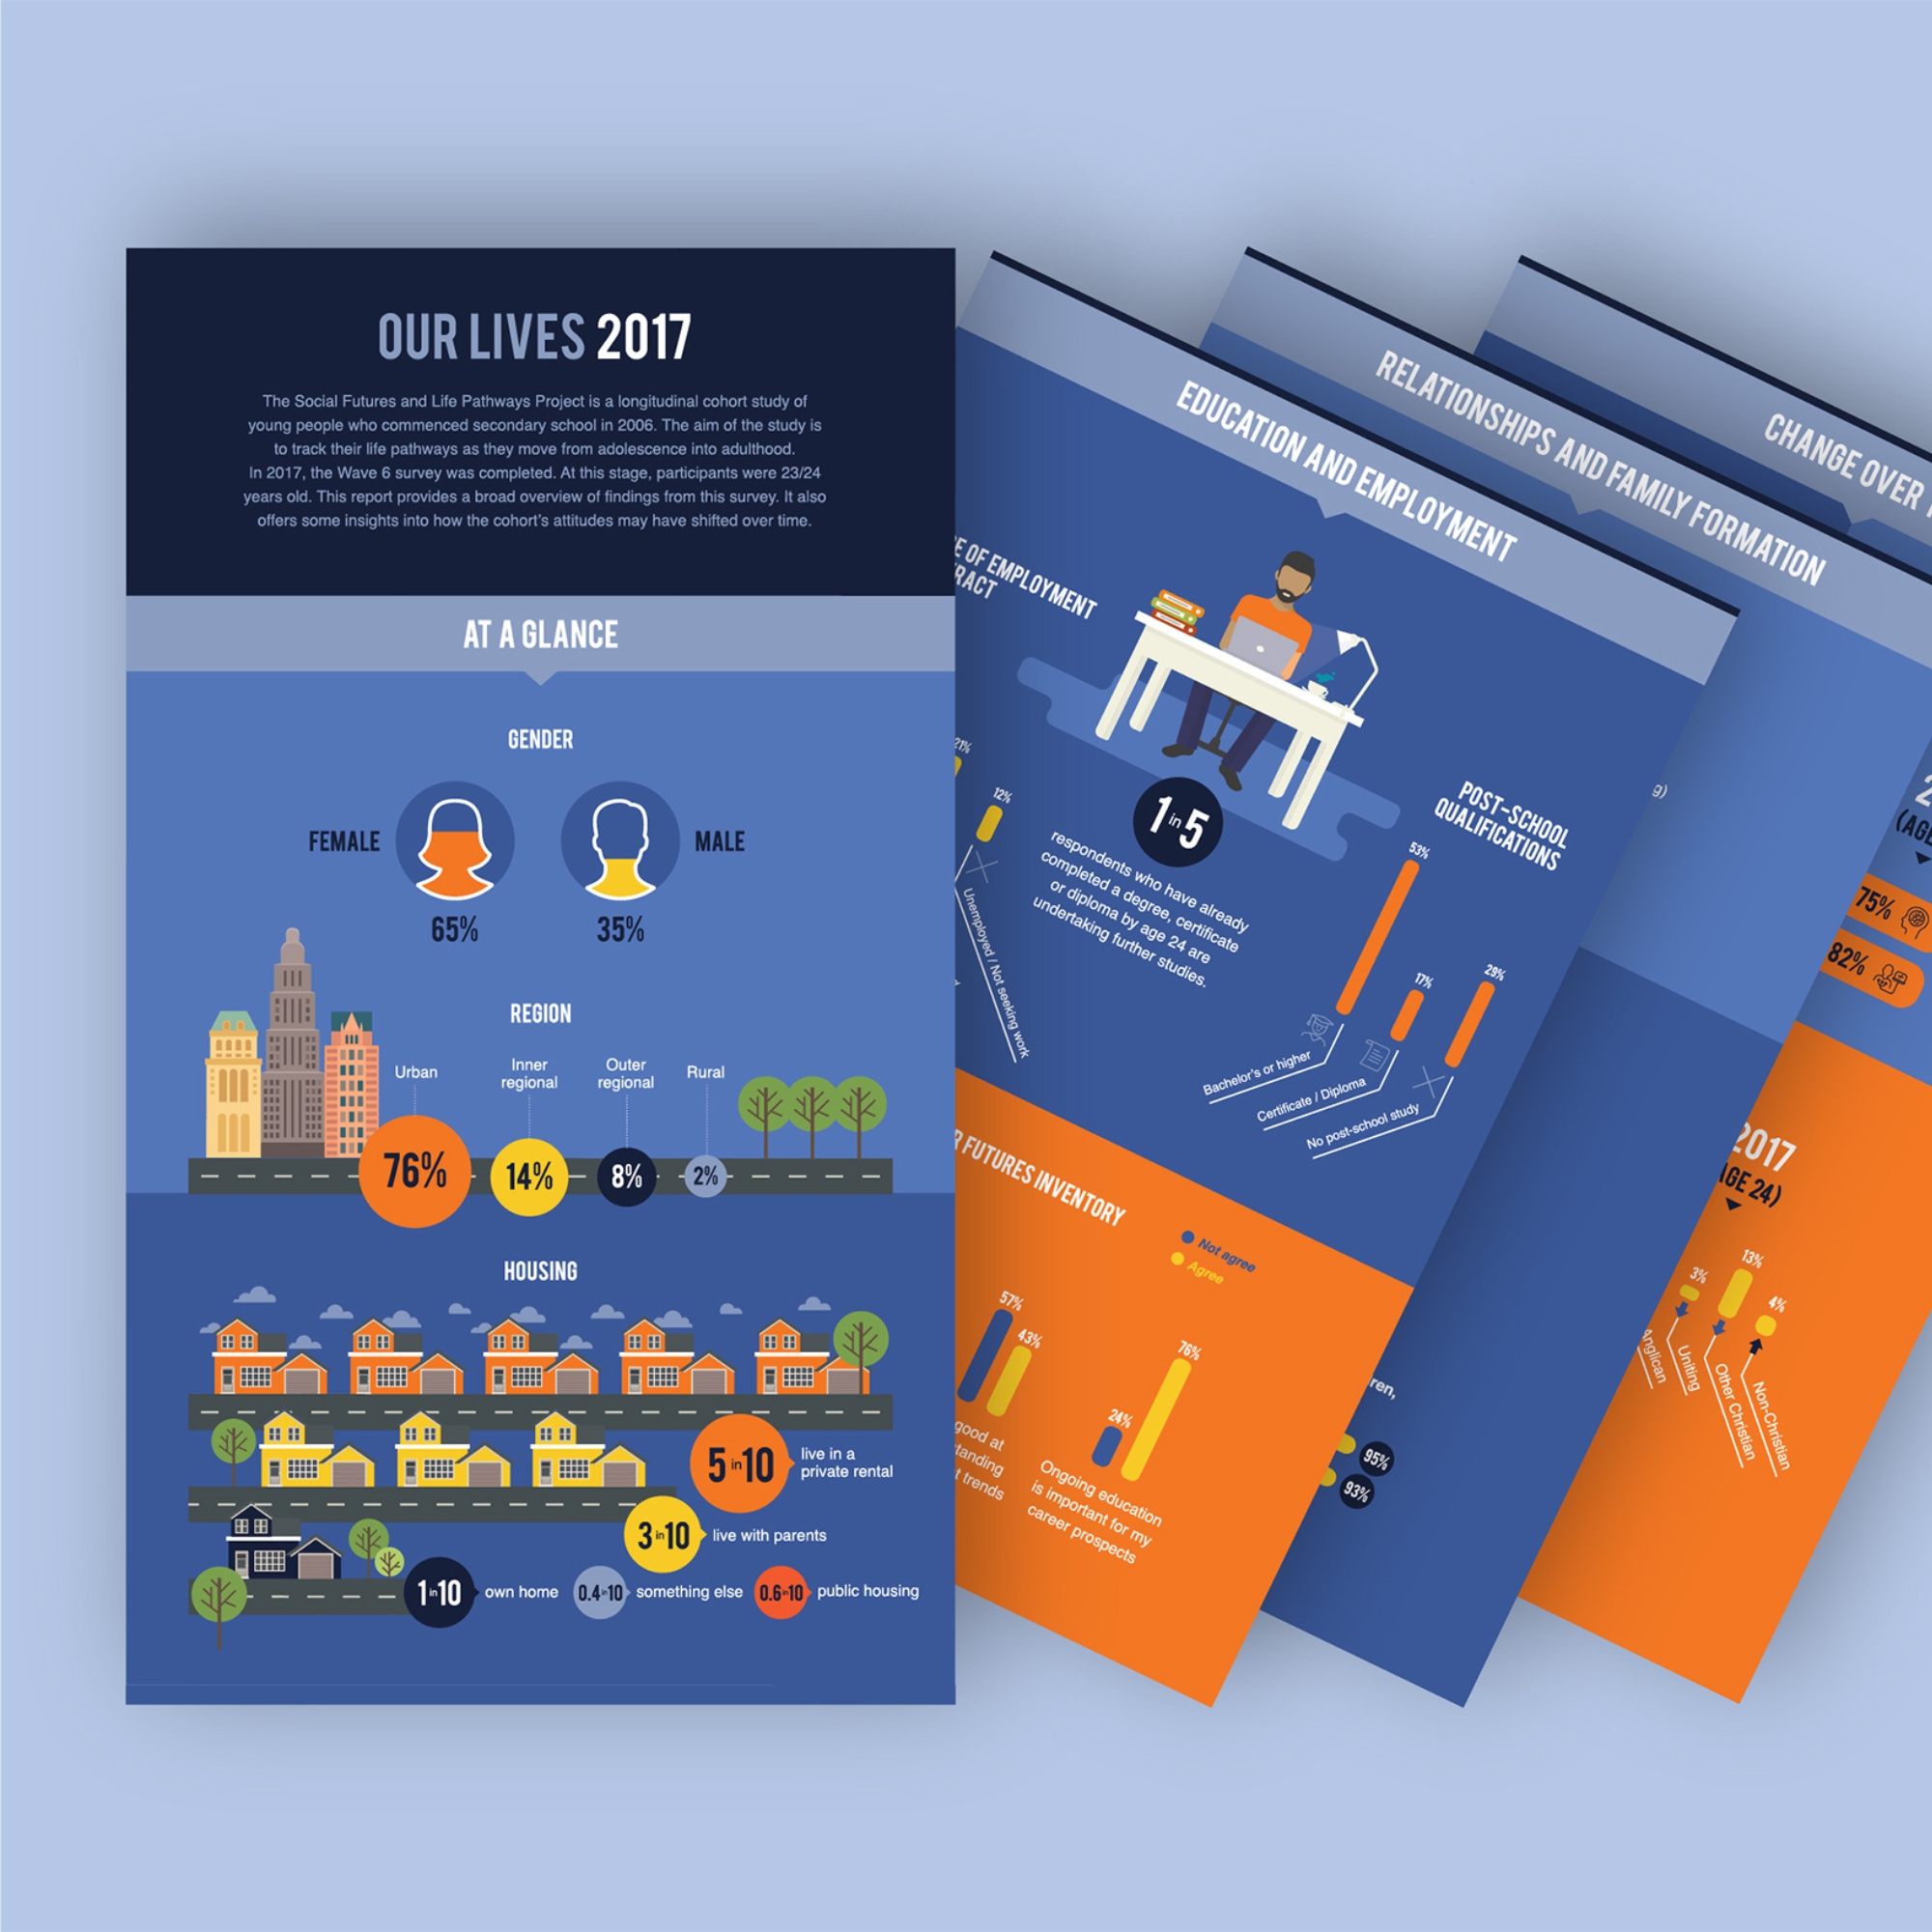
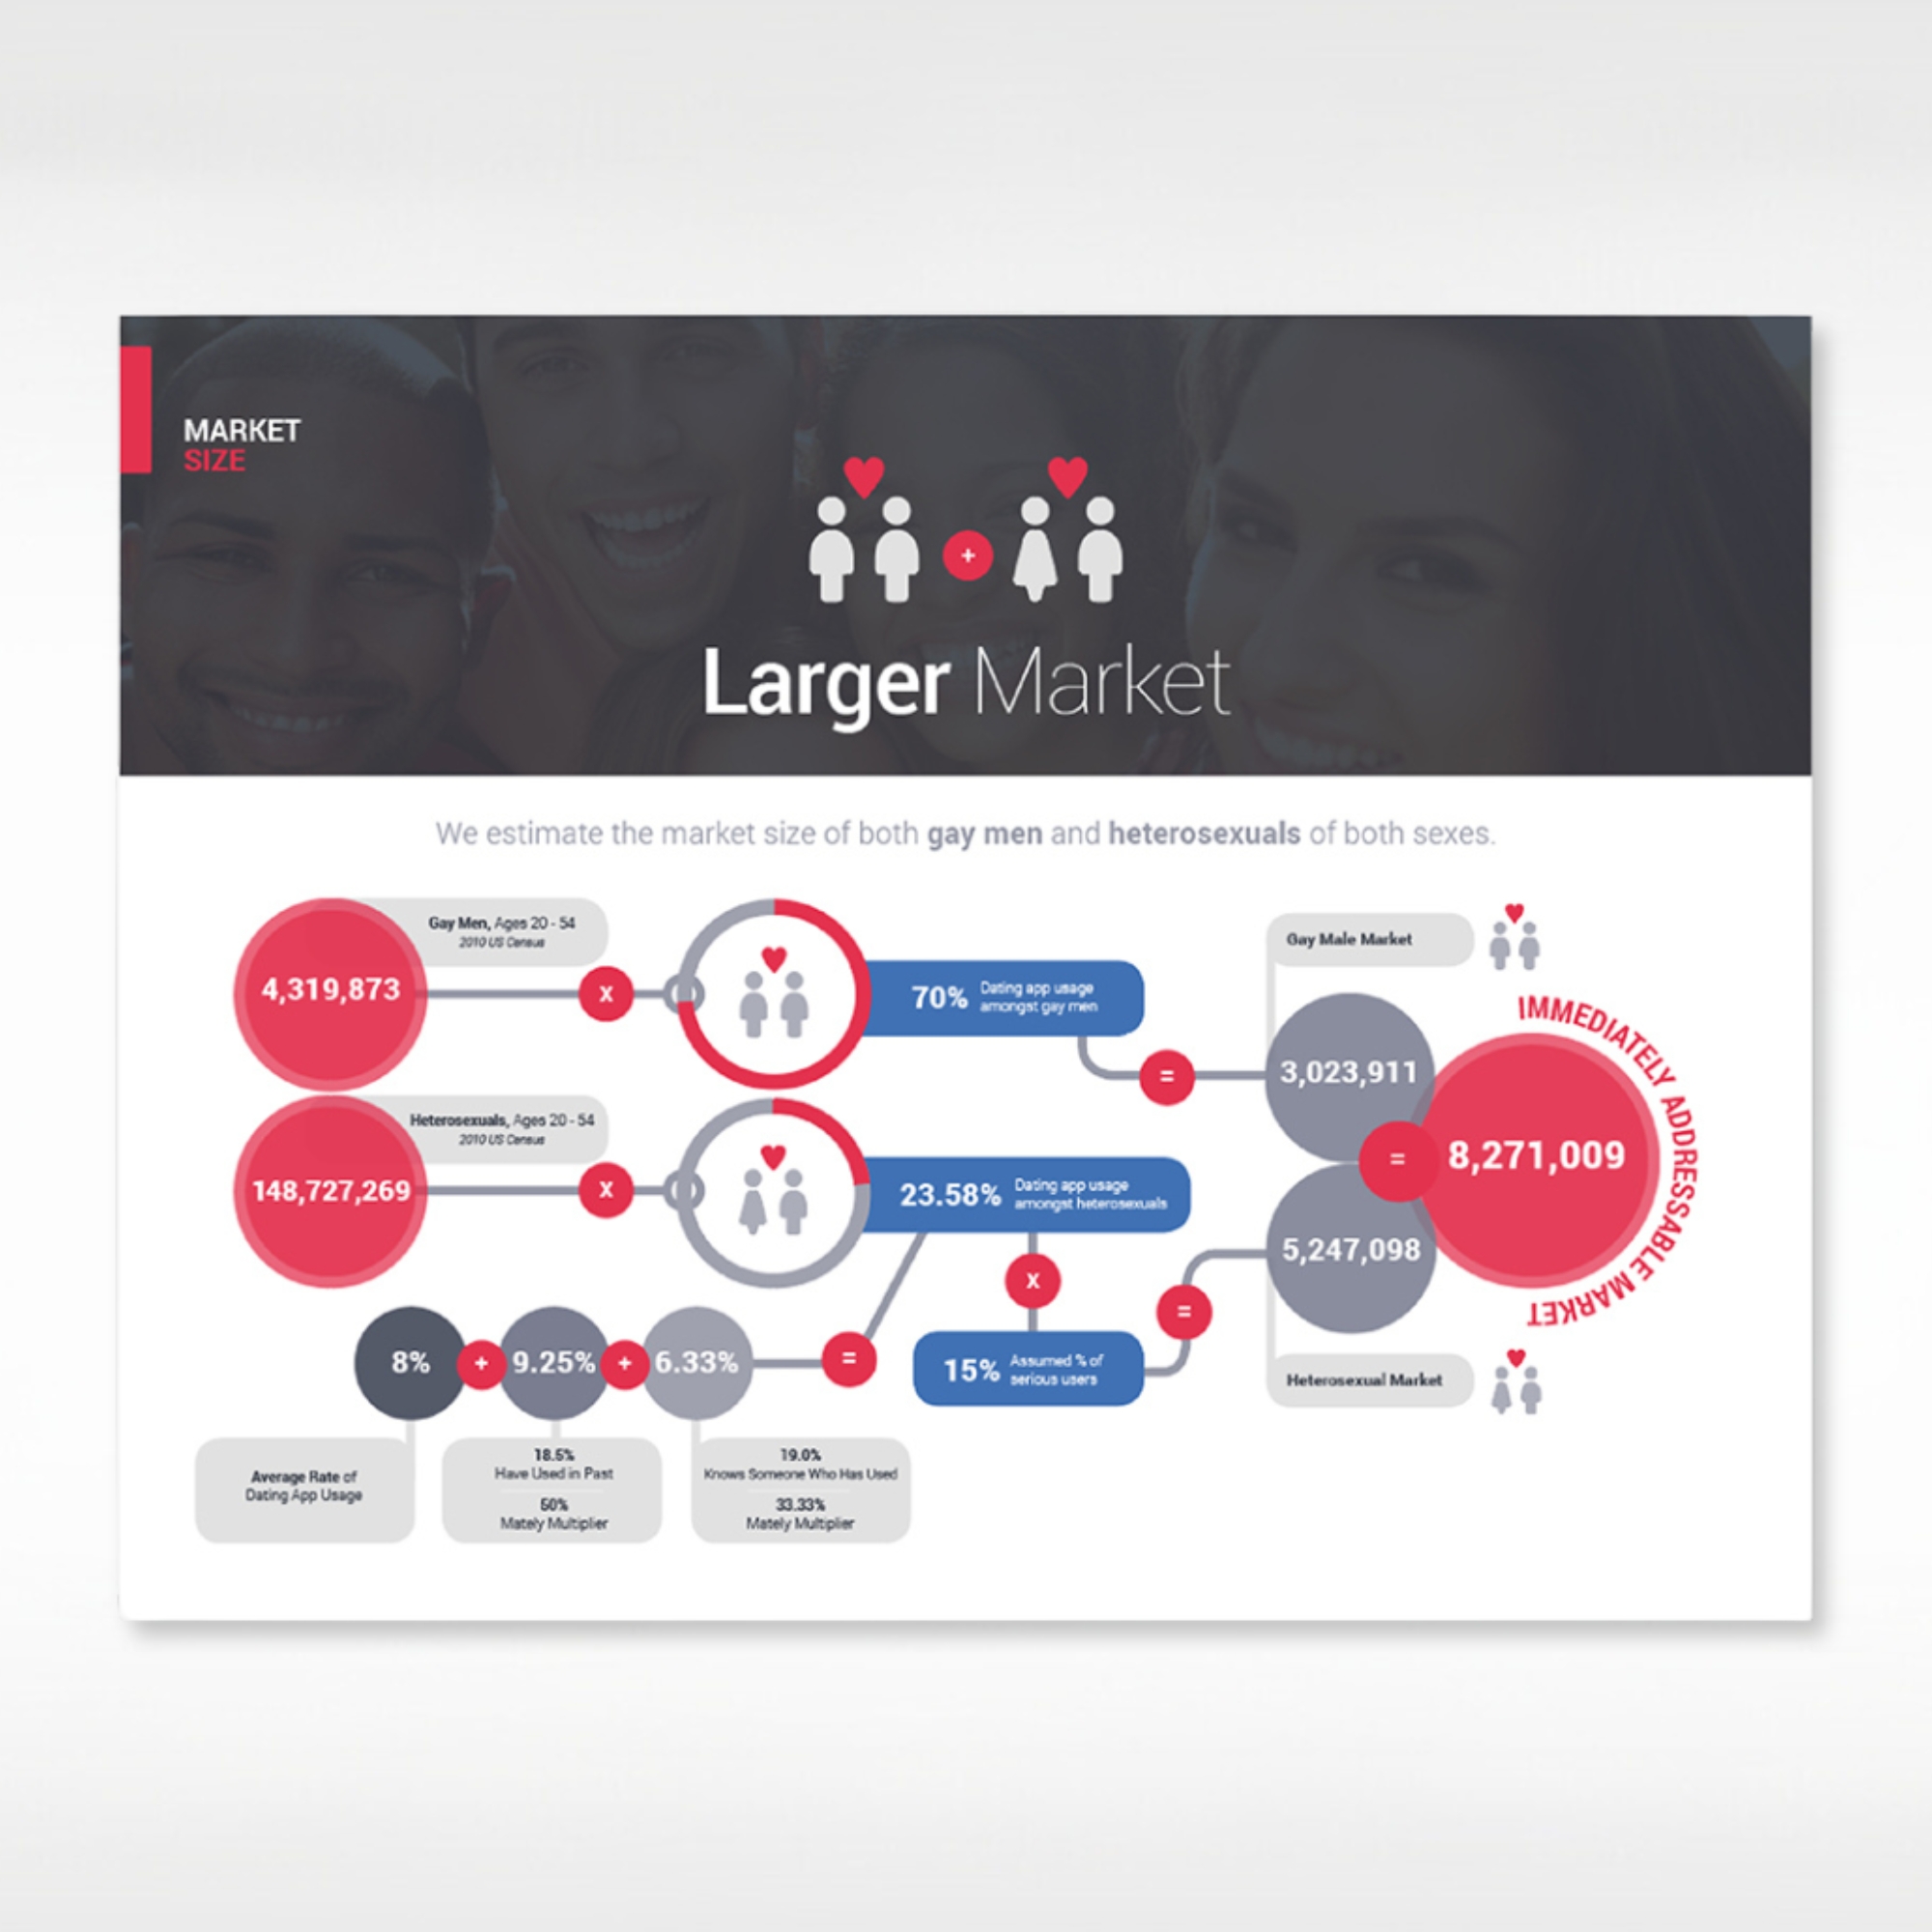
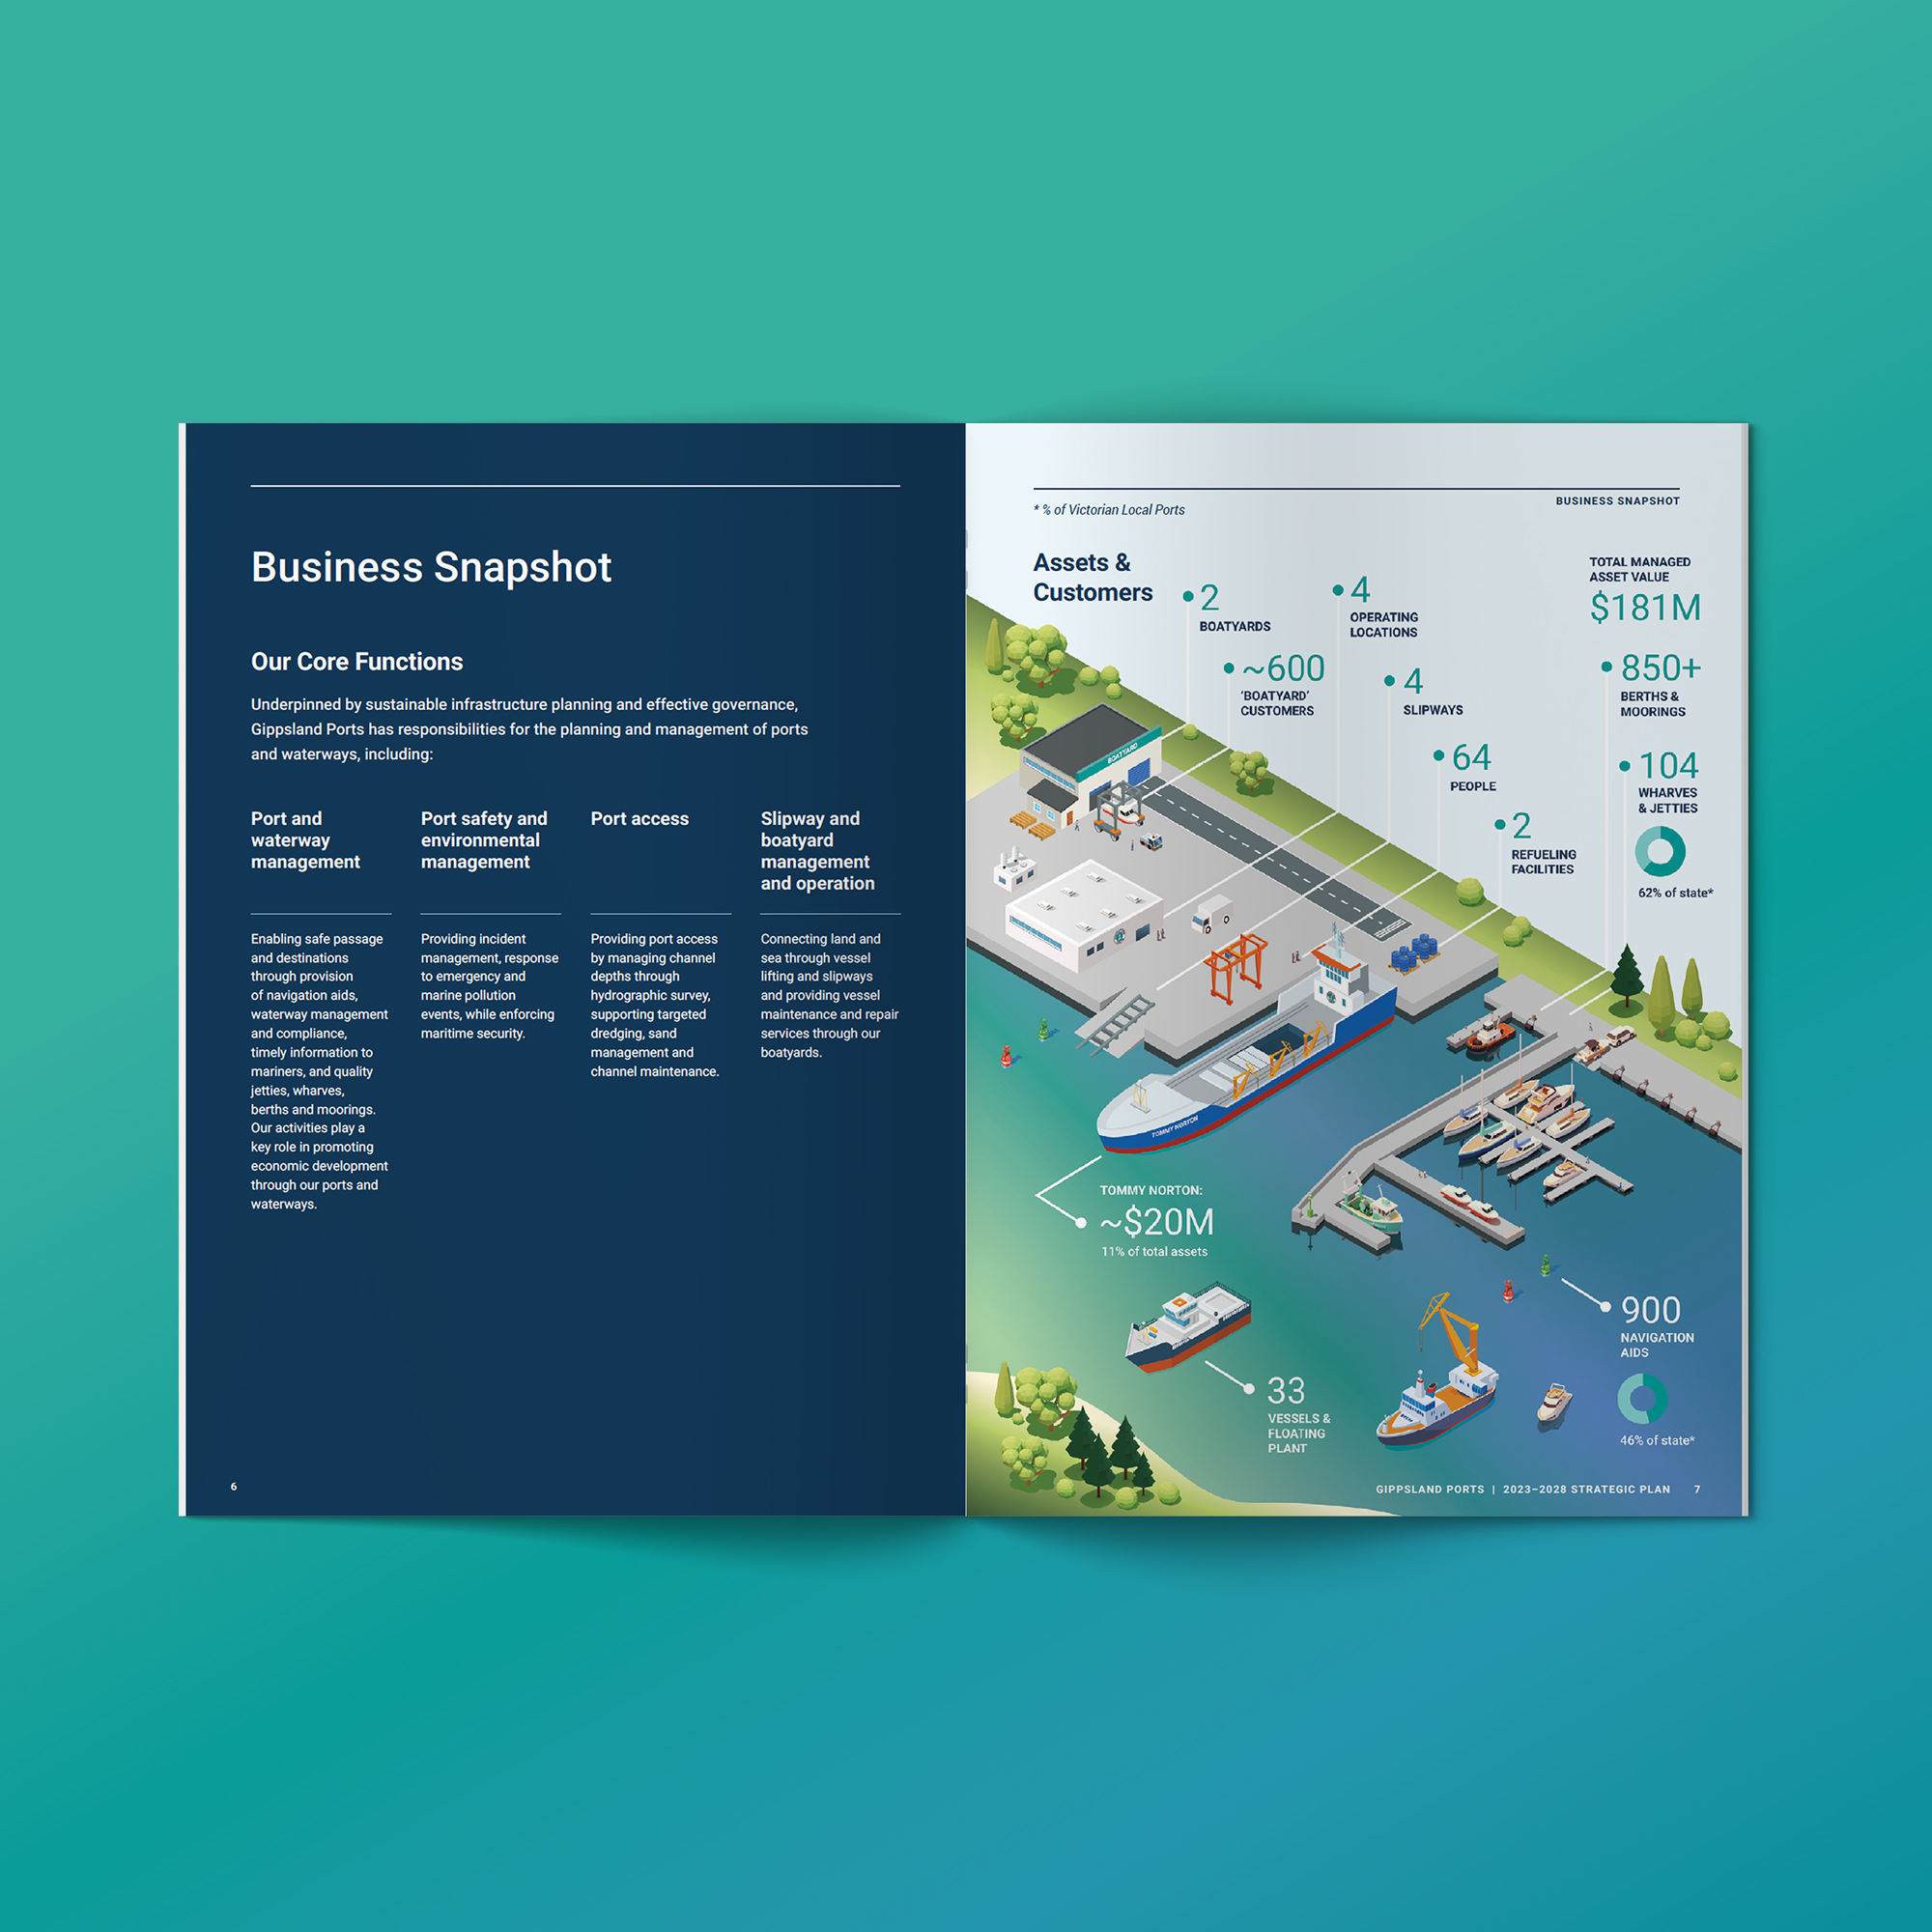
  • Mixed-chart infographics: combining lists, graphs, charts, and maps to present a large volume of data in an illustrative way
  • Charts: such as line, bar, timeline, or comparison charts
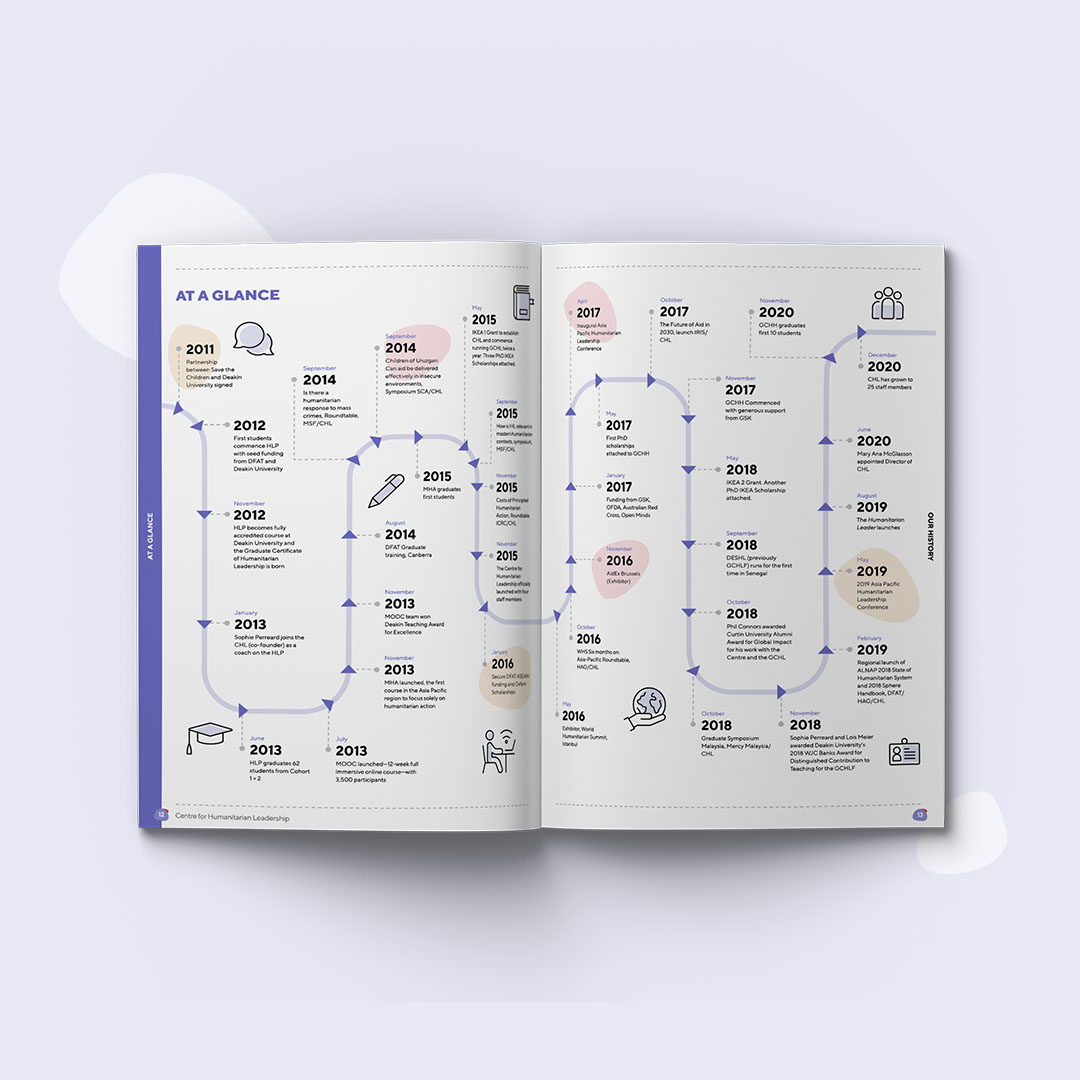
  • Timeline infographics: visualising events or milestones chronologically
  • Informational infographics: mainly text-based, often supported by icons or simple visuals
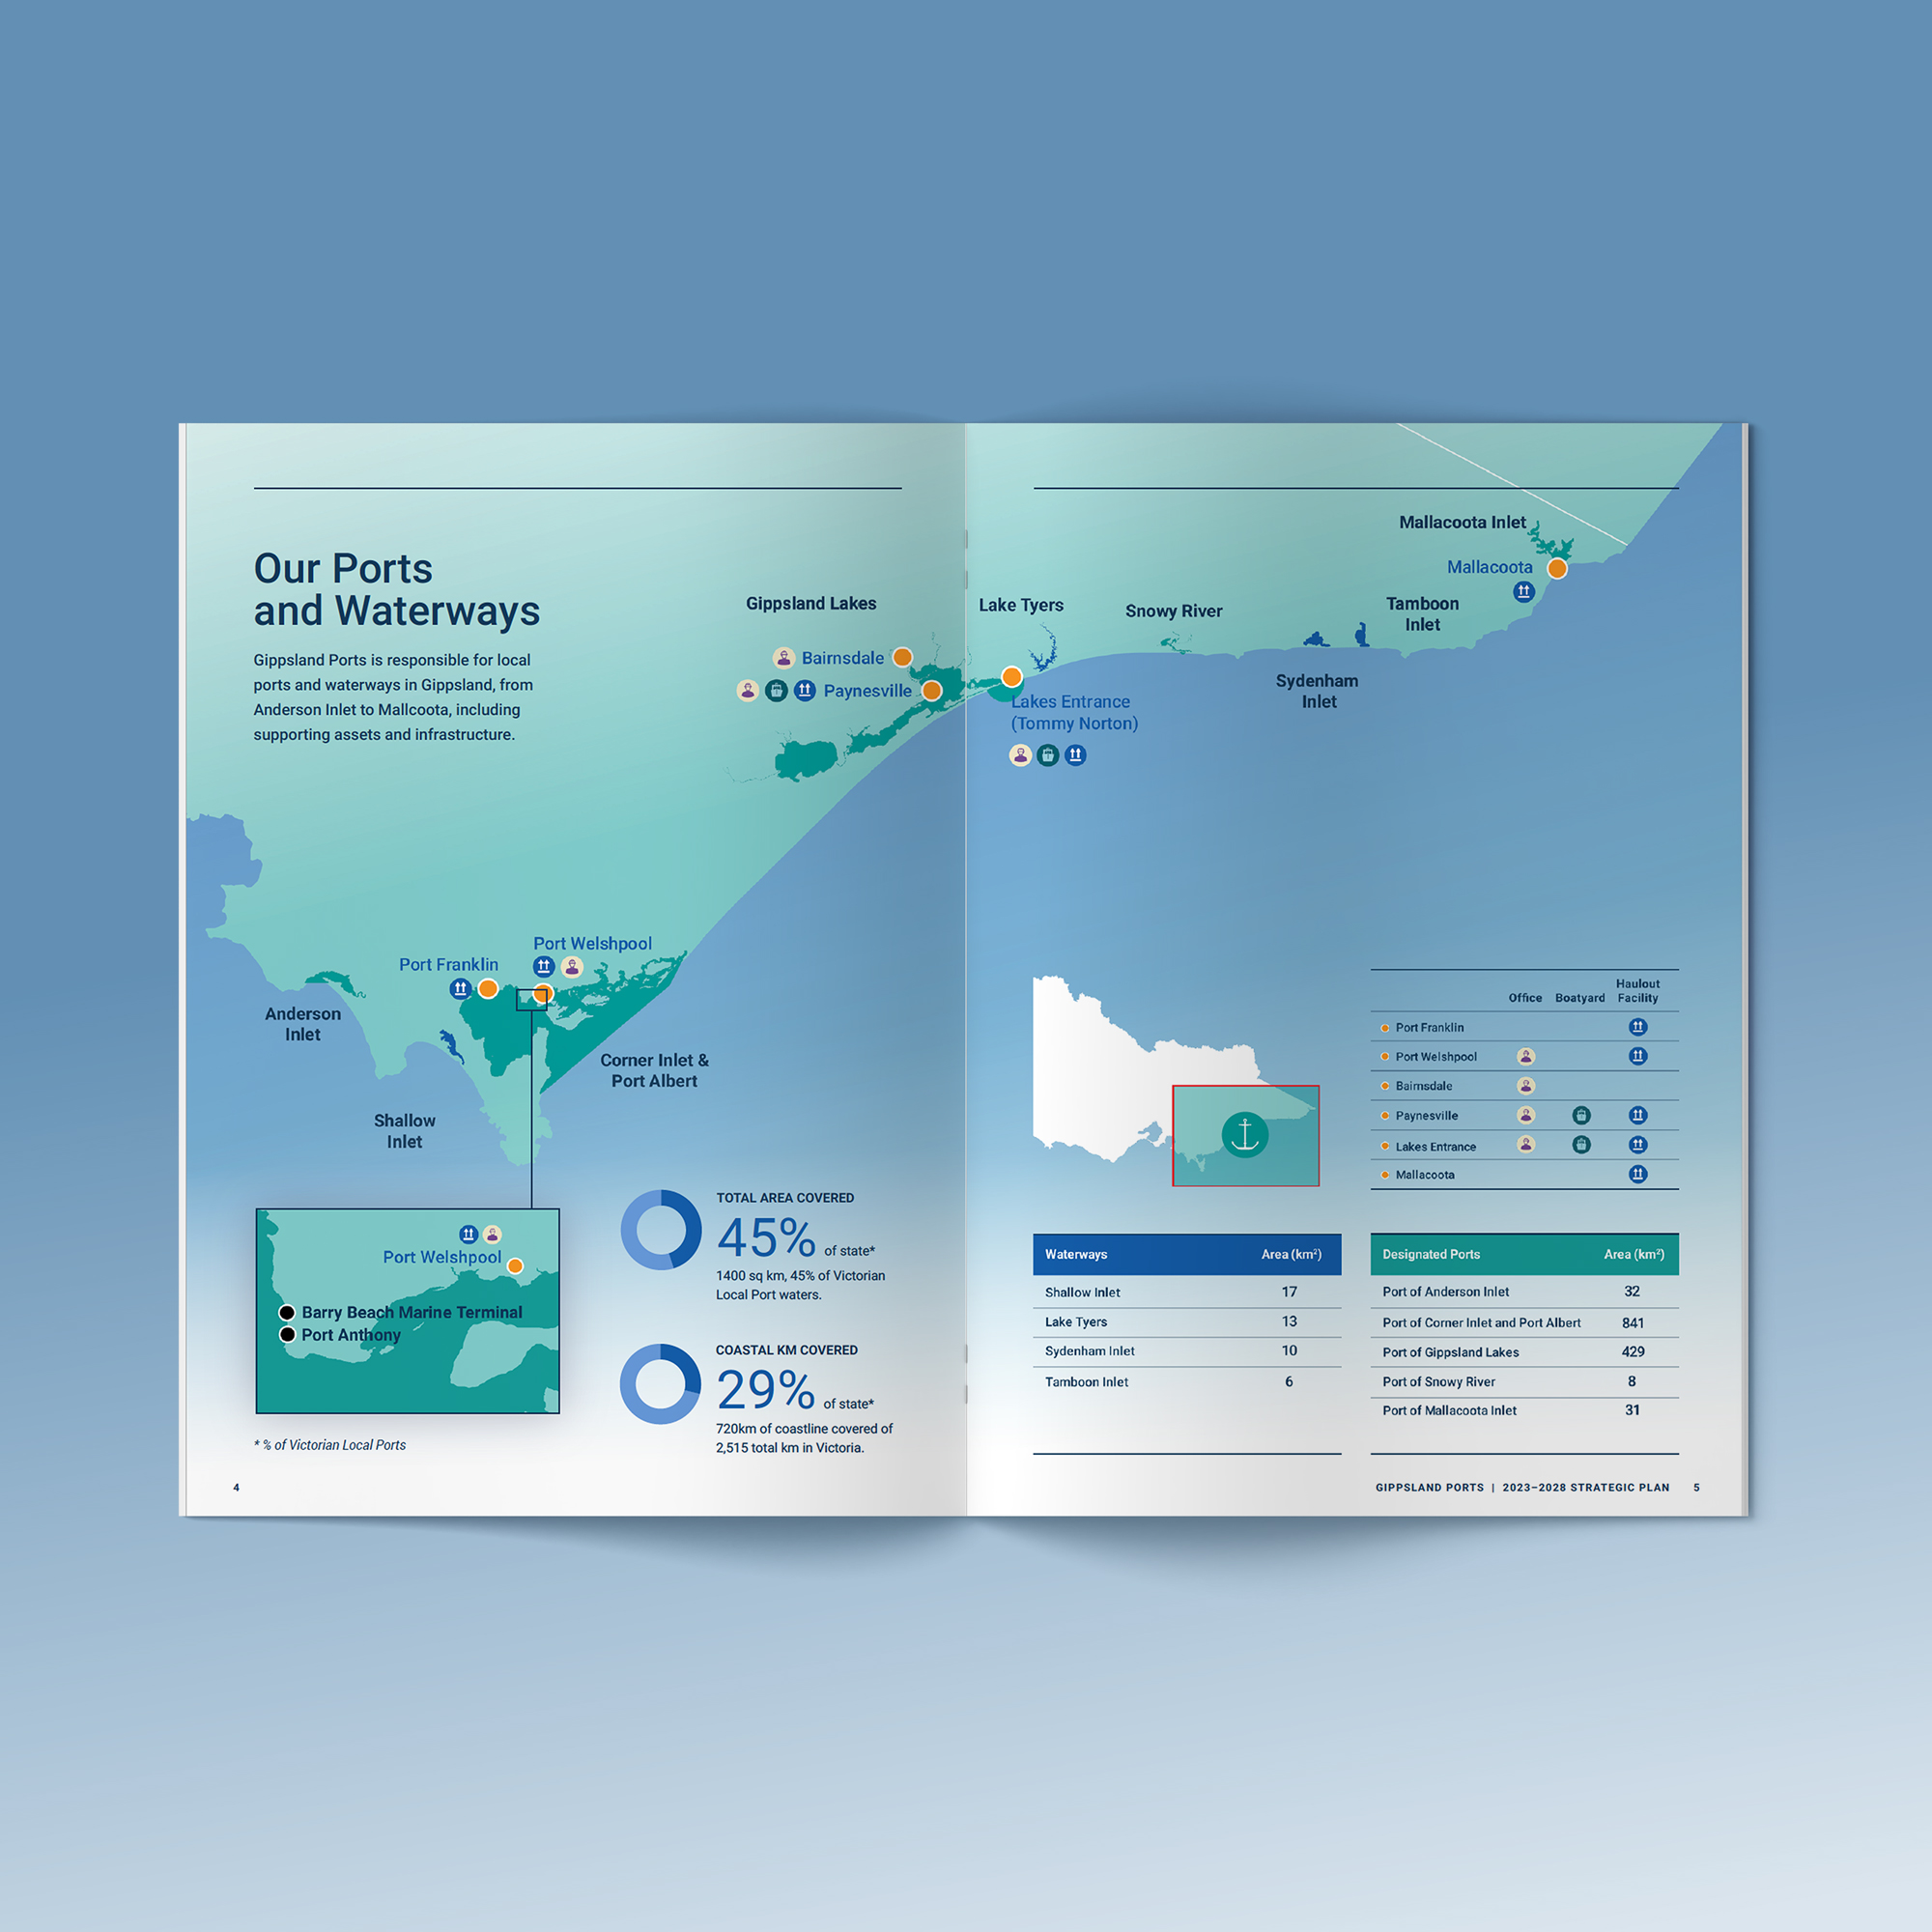
  • Location-based infographics: using detailed maps or geospatial data to present information
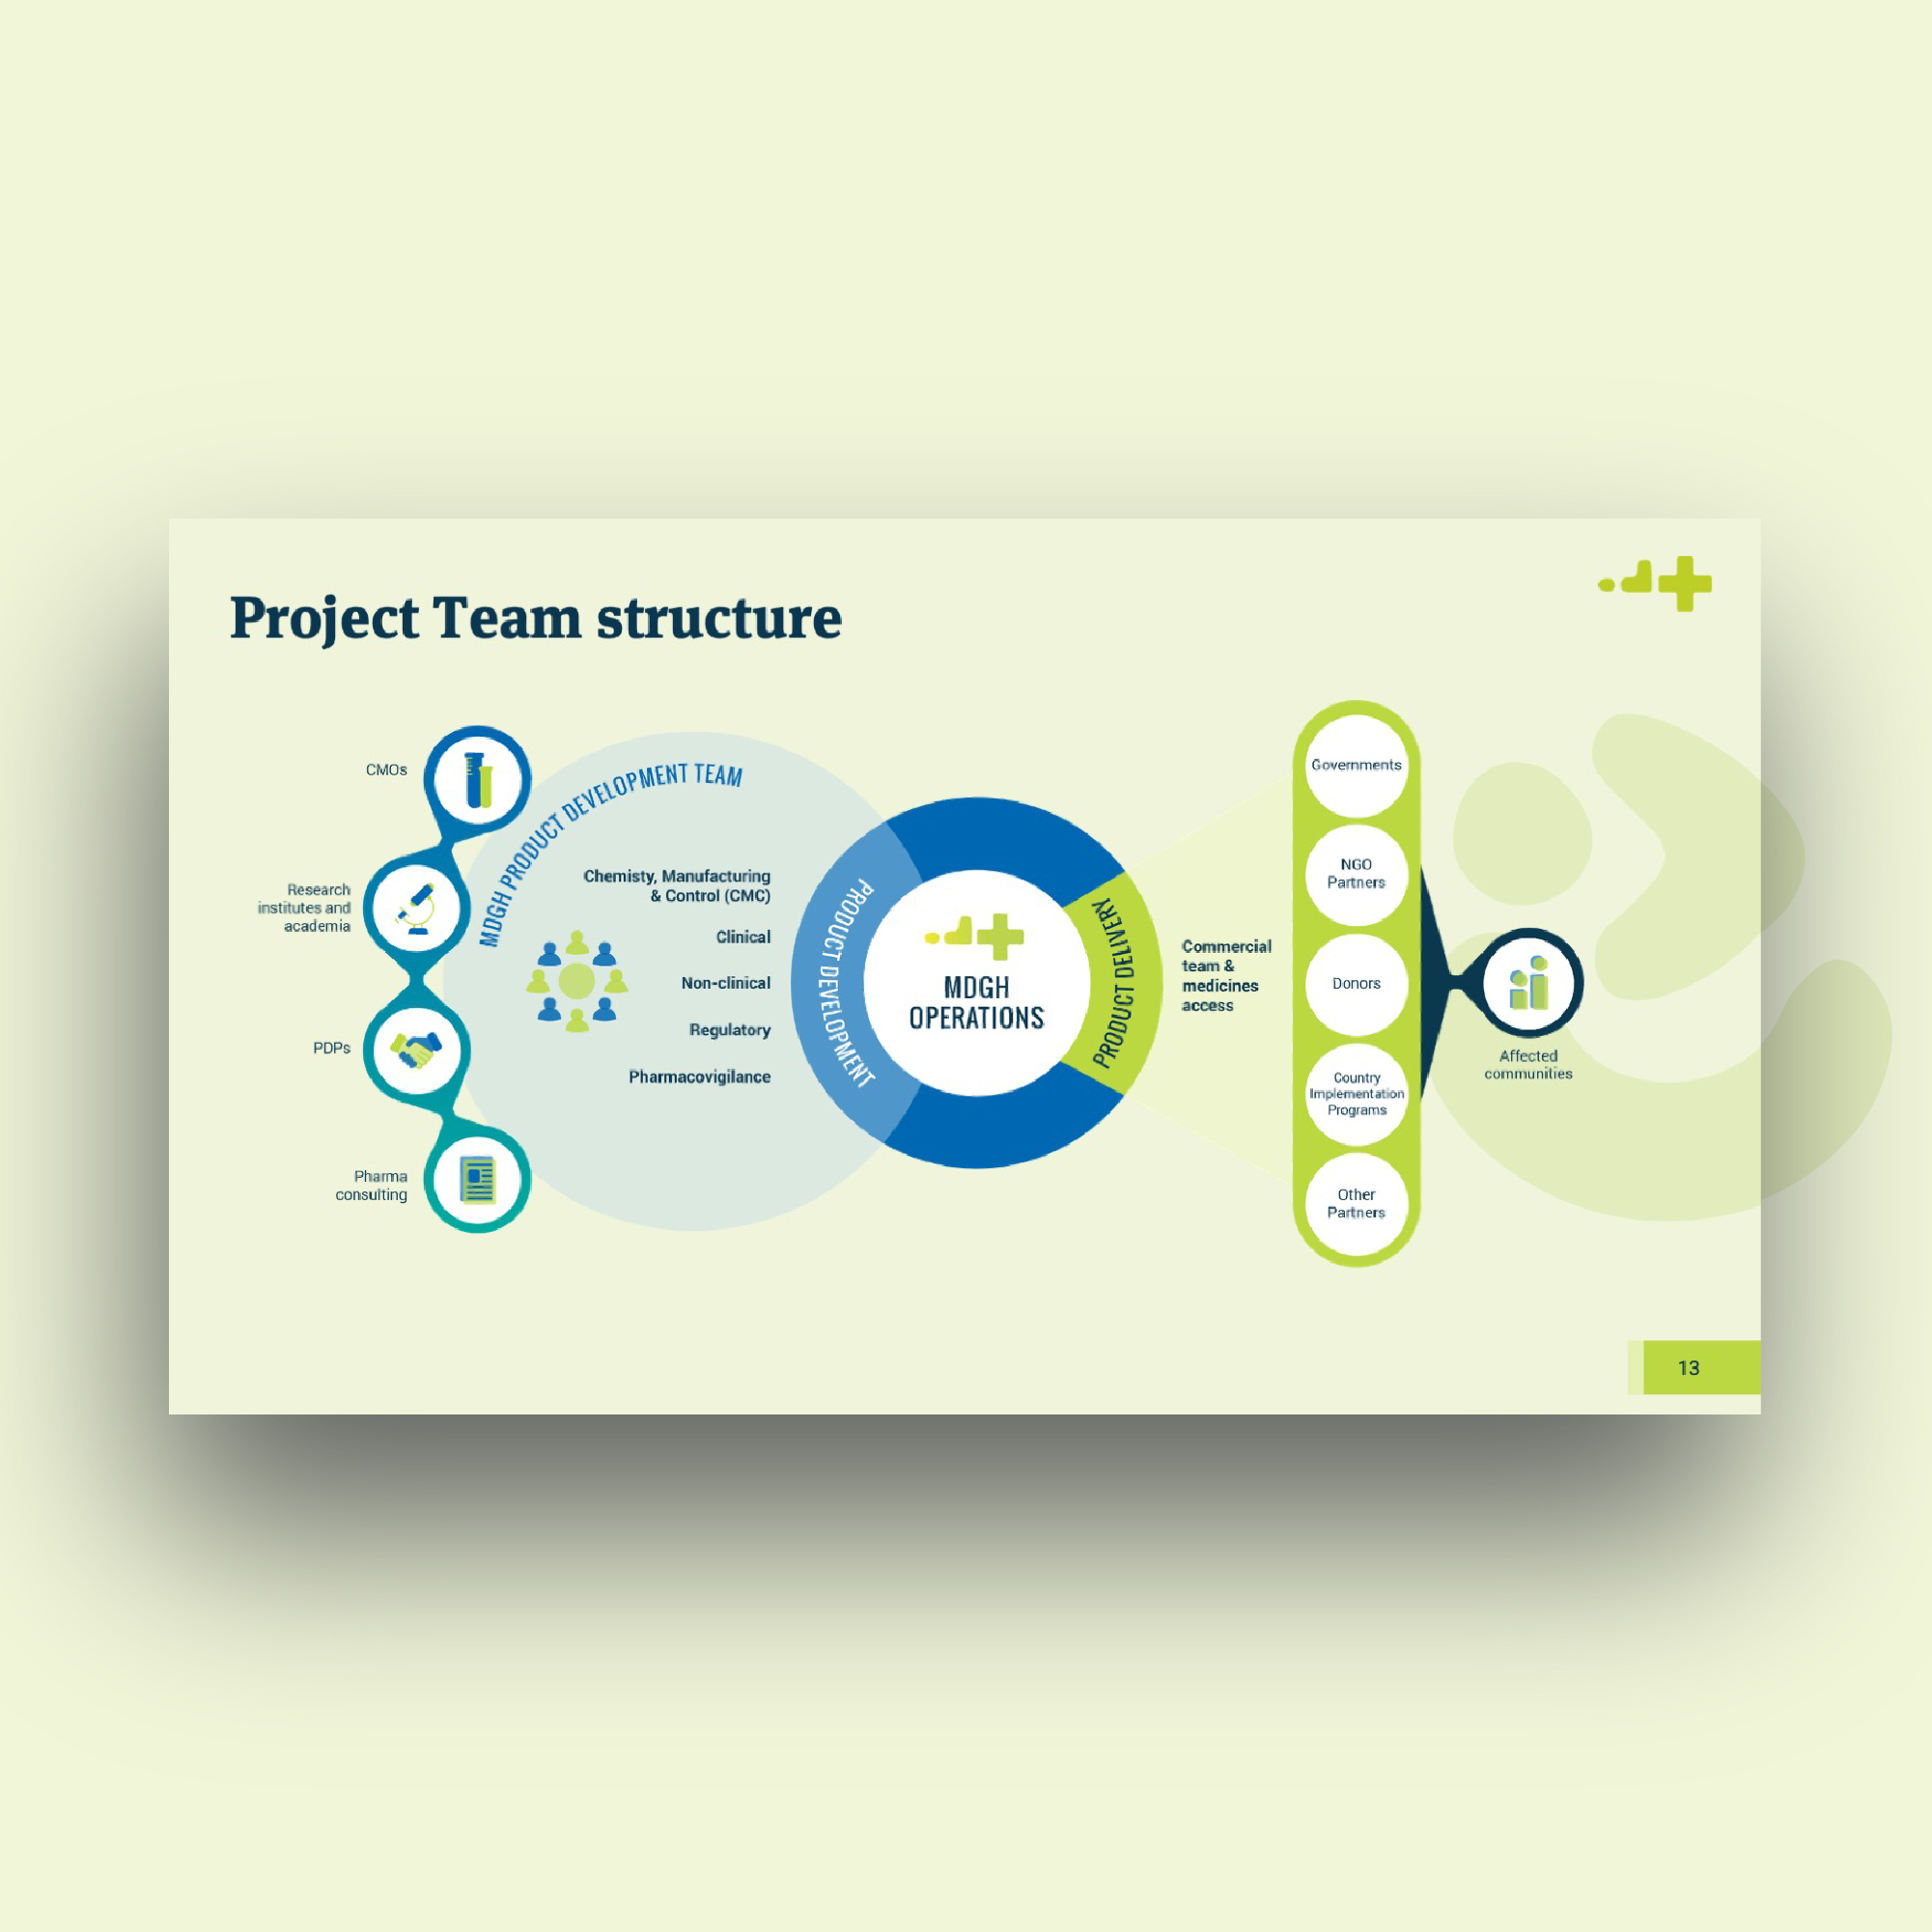
  • Flow charts or hierarchical diagrams: showing processes or structures
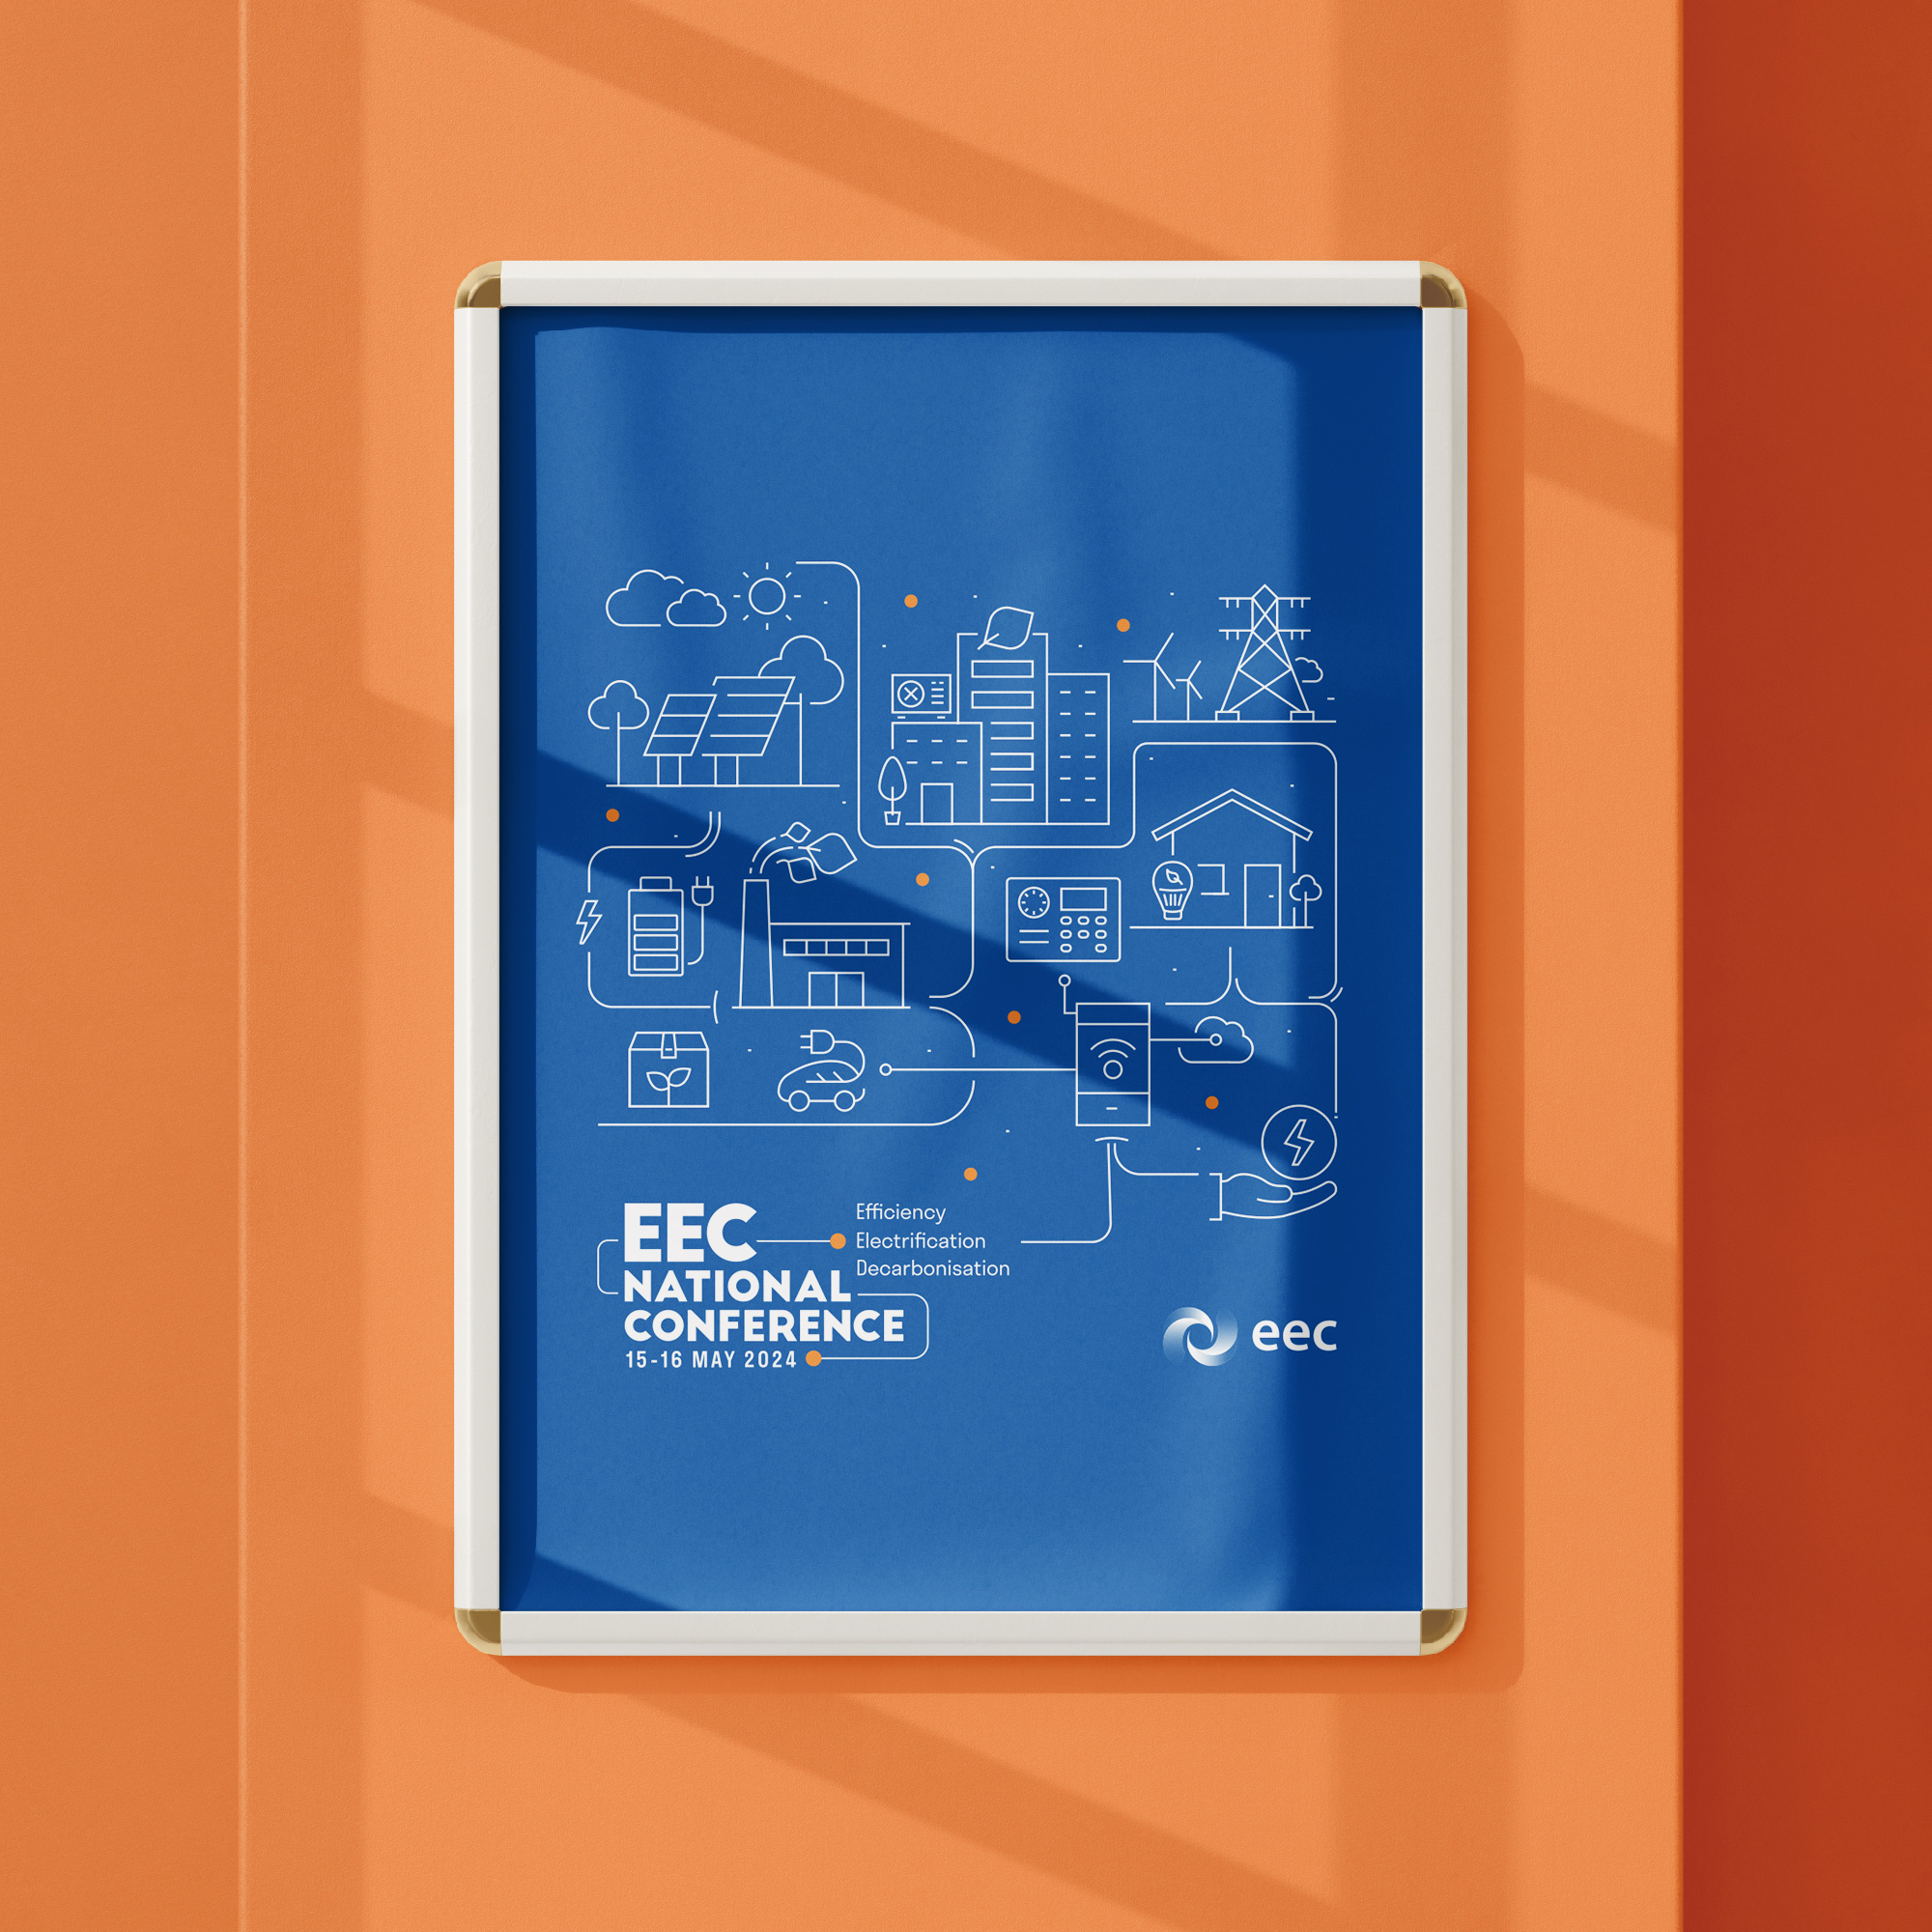
  • Illustrative graphics: hand-drawn or complex vector designs
  • Instructional or technical diagrams
  • And many more!


Can you create infographics for different formats?

Absolutely. We can produce infographics optimised for print, digital PDFs, presentations, websites and interactive formats. Whether you need a set of icons, a single chart or a large-scale visual story, we will ensure your infographic is designed to suit the platform, audience and purpose while maintaining brand consistency across all channels.